. 2012;7(6):e39693.
doi: 10.1371/journal.pone.0039693. Epub 2012 Jun 28.

Amplitude of the SCN clock enhanced by the behavioral activity rhythm

Affiliations

Amplitude of the SCN clock enhanced by the behavioral activity rhythm

Floor van Oosterhout et al. PLoS One. 2012.

Abstract

Circadian rhythms are regulated by the suprachiasmatic nucleus (SCN), a small structure at the base of the hypothalamus. While light effects on the SCN are well established, little is known of behavioral effects. This study elucidates direct modulating action of behavioral activity on the SCN by use of in vivo electrophysiology recordings, assessments of general locomotor behavior, and video-tracking of mice. The results show suppression of SCN neuronal activity by spontaneous behavior, the magnitude being dependent on the intensity, duration and type of behavioral activity. The suppression was moderate (32% of circadian amplitude) for low-intensity behavior and considerable (59%) for locomotor activity. Mild manipulation of the animals had reversed effects on the SCN indicating that different mechanisms are involved in the regulatory effect of spontaneous versus induced activity. The results indicate that exercise at the proper time of the cycle can boost the amplitude of the rhythm of the SCN clock itself. This has potentially beneficial effects for other rhythmic functions that are under the control of the SCN.


Conflict of interest statement

Competing Interests: The authors have declared that no competing interests exist.

Figures

Figure 1
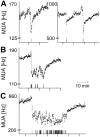
Figure 1. SCN electrical activity is suppressed during brief episodes of spontaneous behavioral activity.
(a) Representative example of 48 h recording of SCN multiunit activity (MUA) in LD12∶12. Bin size is 2 s. The grey background indicates lights off. Lower bars represent simultaneous recordings of movement (all-or-nothing modus), as obtained by a passive infrared detector. (b) Expanded plots of SCN electrical activity during episodes of behavioral activity at mid-day as indicated by squared blocks in A. The X-axis shows Zeitgeber Time (hours) and the Y-axis shows SCN firing rate (Hz).
Figure 2
Figure 2. Time course of suppressions of SCN electrical activity during spontaneous behavioral activity.
The start of behavioral activity is characterized by an acute drop of SCN firing rate. Decreased levels of SCN electrical activity are typically sustained throughout the duration of behavioral activity. Representative examples of different durations are shown. Behavioral activity and associated suppressed levels of SCN electrical activity last for approximately (a) 10 s, (b) 10 min, and (c) 30 min. Behavioral activity as detected by the passive infrared detector is plotted in the lower bar (all-or-nothing modus). Note that the PIR detector does not detect all behavioral activity which became apparent from the video recordings. Suppressions that lasted <1 min were observed in ∼20% of the cases, the occurrence of suppressions of 1–25 min was ∼ 65%, and the occurrence of long suppressions of >25 min was ∼15%. In each figure, the X-axis represents time (scale unit is given by the bar in the figure). Suppressions of all shown examples occurred between Zeitgeber Time (ZT) 3 and ZT10) under LD conditions. The Y-axis shows SCN firing rate (Hz). Bin size is 10 s.
Figure 3
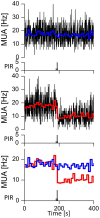
Figure 3. Electrical activity simultaneously recorded from two SCN sub-populations.
Action potential thresholds were set off-line in such a way that an average firing frequency of 18 Hz was measured during baseline, in order to obtain approximately equal-sized populations of neurons. Bin size is 0.5 s, and lines in color represent the averaged firing frequency per 10 s. Spikes between excluding thresholds were counted, and revealed that the decreased firing rate during behavioral activity is apparent in some neurons (lower graph), while it is not present in others (upper graph). For comparison, the averaged firing frequencies are plotted in one graph below.
Figure 4
Figure 4. Relationship between type and intensity of behavioral activity and SCN electrical activity.
(a) The SCN electrical activity profile as recorded throughout a full episode of behavioral activity (approximately 45 min). Lower bars represent the type of behavior as scored by video-observation. Behavioral activity as recorded by passive infrared detector is depicted at the bottom of the MUA trace in a graded scale. In this example, the initial behavior leading to a suppression of SCN activity is associated with moving, and is followed by eating which does not induce further suppression but keeps the SCN electrical activity at a reduced level. A further decrease of spike rate is induced when the animal starts locomotor behavior. While the suppression lasts for the full duration of the behavioral activity bout, gradual changes are associated with different types or intensities of behavior, and electrical activity gradually returns to baseline when the animal has ceased its behavioral activity. (b) The magnitude of suppression represented as a function of type of behavioral activity that initiated the suppression. Magnitude of suppression was significantly different between groups (*P<0.01, ANOVA with post hoc Bonferroni test). N-values are given between brackets. Error bars represent the standard error of the mean.
Figure 5
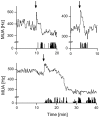
Figure 5. SCN electrical activity in response to mild disturbance of the animal’s rest during the day.
The disturbance was established by making a small movement of the cage, without touching the animal. The timing of disturbance is given by the arrow. The increment of SCN discharge levels is acute, and returned to baseline quickly. In some cases the increment in electrical activity was followed by a suppression in electrical activity when behavioral activity continued (lower graph). It is possible that in these cases, induced activity had changed into motivated activity. Behavioral activity as recorded by passive infrared detector is depicted at the bottom of each MUA trace in a graded scale.
Figure 6
Figure 6. Circadian profile of SCN electrical activity in the presence and absence of PIR-recorded behavioral activity.
To visualize the effect of behavioral activity on SCN rhythm amplitude, the passive infrared activity data are integrated in the electrical activity data: whenever passive infrared movement was detected during a 10 s recording bin, the number of SCN spikes counted in that bin is represented by a black dot. Grey dots show multiunit activity data points from bins when no movement was detected. Eye-fitted lines were drawn through grey dots (blue line) and black dots (red line) to illustrate the presence of a circadian rhythm in either profile. The LD12∶12 light cycle is indicated above the record (white, lights on; black, lights off).
Figure 7
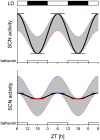
Figure 7. Consequence of night- versus day-time activity on SCN rhythm amplitude.
Blue line represents the SCN activity in the absence of behavioral activity; red line represents the SCN activity in the presence of behavioral activity. Both lines are based on results shown in Figure 6. The black lines represent two extreme possibilities: (a) when behavioral activity is concentrated during the night and is absent during the day, the amplitude of the SCN electrical activity is maximal. (b) In contrast, when behavioral activity would occur during the day and rest occurs during the night, the SCN amplitude will be negatively affected and shows a reduced amplitude. Horizontal lines indicate peak and trough SCN activity levels. The LD12∶12 light cycle is indicated above the record (white, lights on; black, lights off).

Similar articles

Cited by

References

    1. Klein DC, Moore RY, Reppert SM. Suprachiasmatic nucleus: the mind’s clock. New York: Oxford Univ. Press. 1991.
    1. Kalsbeek A, Foppen E, Schalij I, Van Heijningen C, van der Vliet J, et al. Circadian control of the daily plasma glucose rhythm: an interplay of GABA and glutamate. PLoS One. 2008;3:e3194. - PMC - PubMed
    1. Morin LP, Allen CN. The circadian visual system. Brain Res Rev. 2006;51:1–60. - PubMed
    1. Antle MC, Mistlberger RE. Circadian clock resetting by sleep deprivation without exercise in the Syrian hamster. J Neurosci. 2000;20:9326–9332. - PMC - PubMed
    1. Mrosovsky N. Phase response curves for social entrainment. J Comp Physiol A. 1988;162:35–46. - PubMed

Publication types