

The role of fine-scale anatomical structure in the dynamics of reentry in computational models of the rabbit ventricles
- PMID: 22753546
- PMCID: PMC3467803
- DOI: 10.1113/jphysiol.2012.229062
The role of fine-scale anatomical structure in the dynamics of reentry in computational models of the rabbit ventricles
Abstract
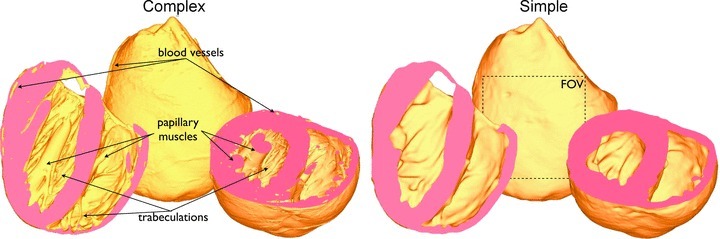
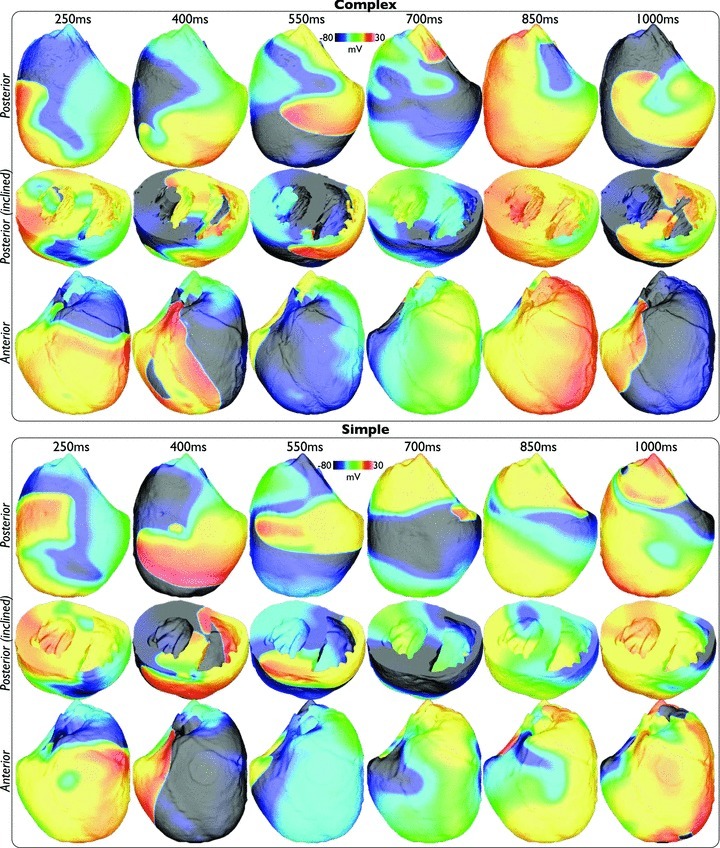
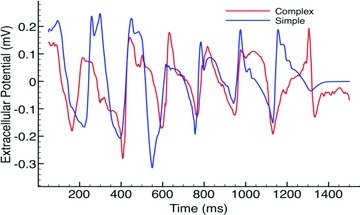
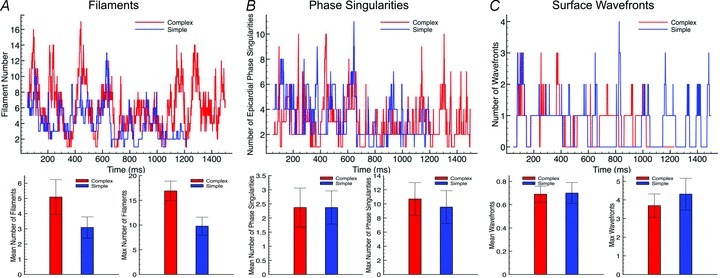
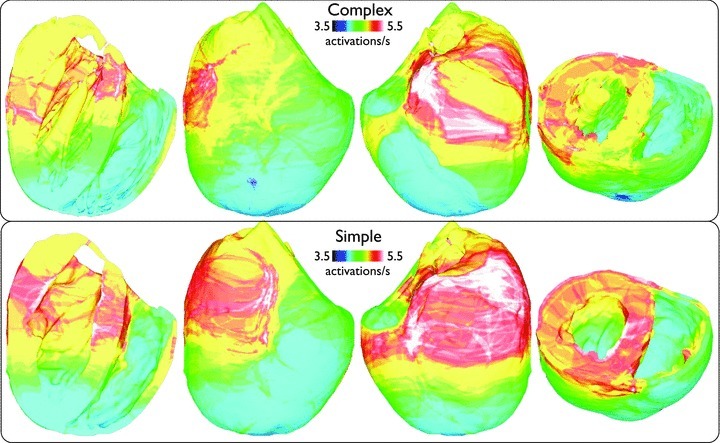
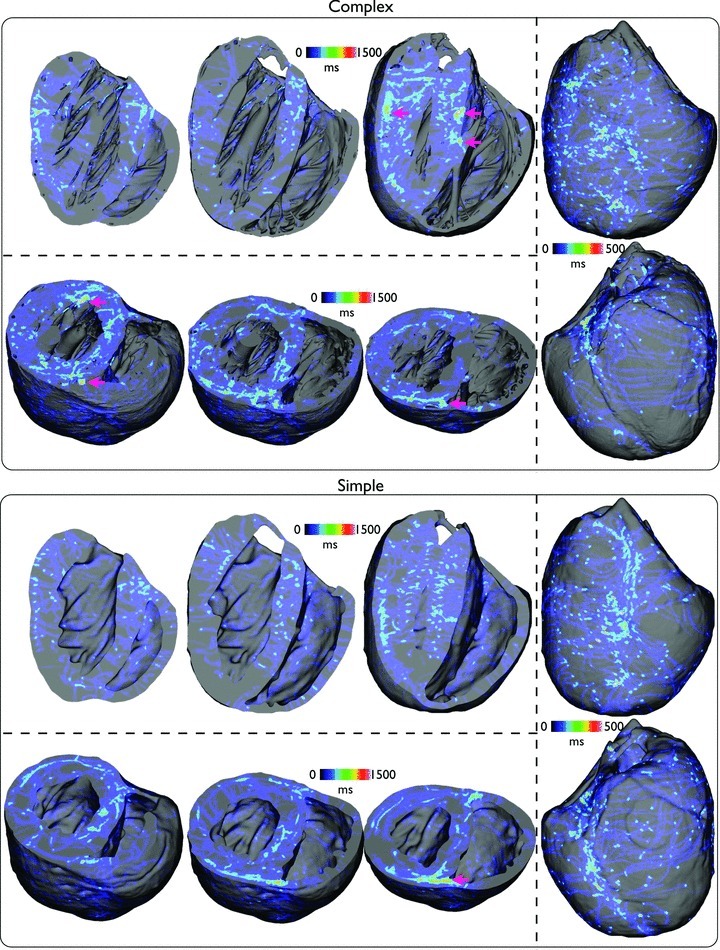
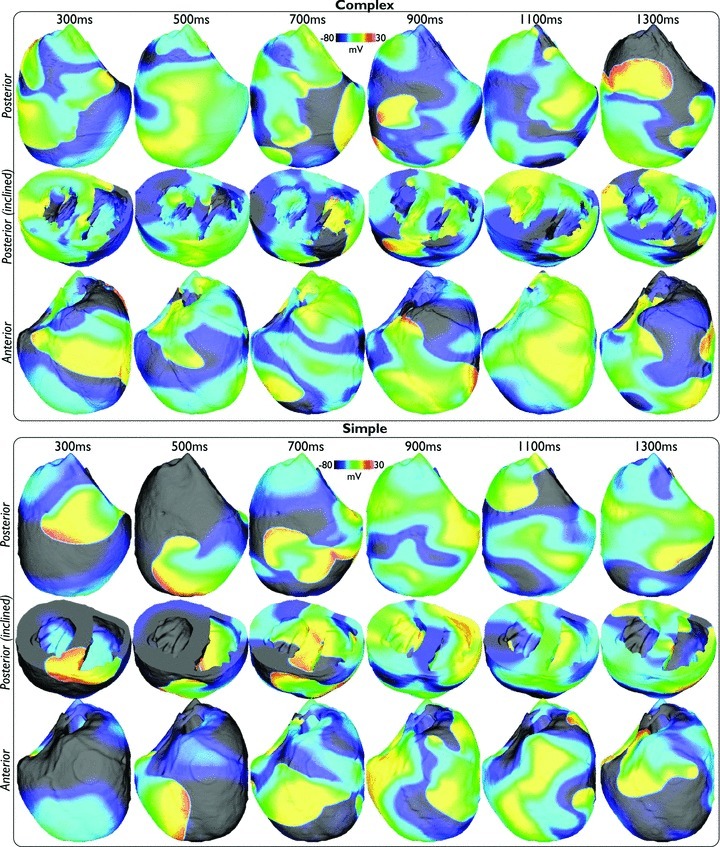
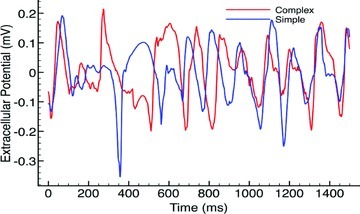
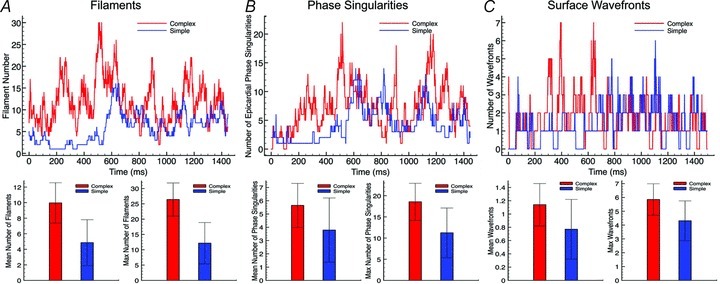
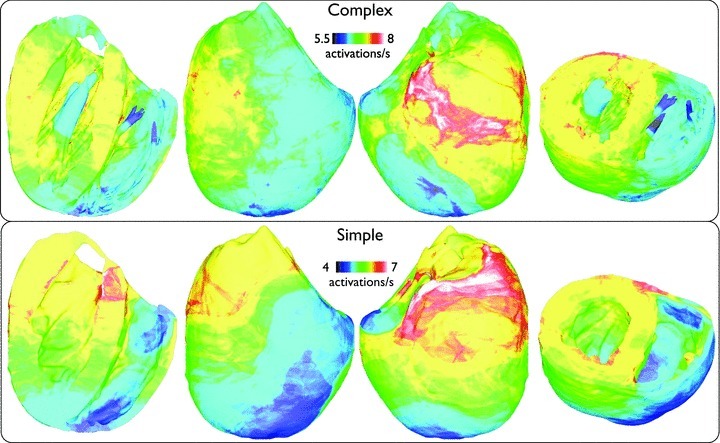
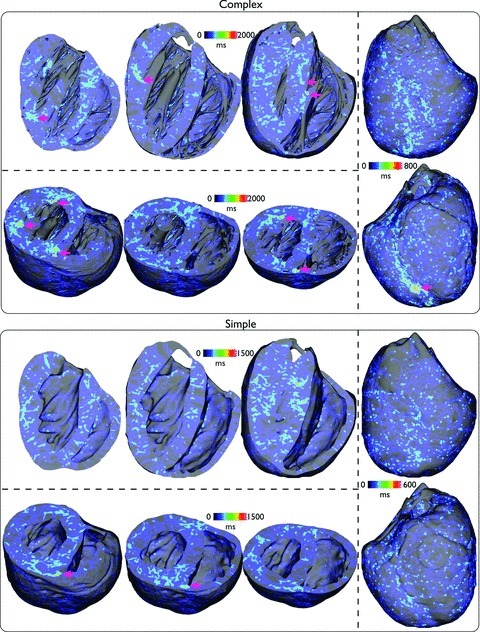
Fine-scale anatomical structures in the heart may play an important role in sustaining cardiac arrhythmias. However, the extent of this role and how it may differ between species are not fully understood. In this study we used computational modelling to assess the impact of anatomy upon arrhythmia maintenance in the rabbit ventricles. Specifically, we quantified the dynamics of excitation wavefronts during episodes of simulated tachyarrhythmias and fibrillatory arrhythmias, defined as being respectively characterised by relatively low and high spatio-temporal disorganisation.Two computational models were used: a highly anatomically detailed MR-derived rabbit ventricular model (representing vasculature, endocardial structures) and a simplified equivalent model, constructed from the same MR-data but lacking such fine-scale anatomical features. During tachyarrhythmias, anatomically complex and simplified models showed very similar dynamics; however, during fibrillatory arrhythmias, as activation wavelength decreased, the presence of fine-scale anatomical details appeared to marginally increase disorganisation of wavefronts during arrhythmias in the complex model. Although a small amount of clustering of reentrant rotor centres (filaments) around endocardial structures was witnessed in follow-up analysis (which slightly increased during fibrillation as rotor size decreased), this was significantly less than previously reported in large animals. Importantly, no anchoring of reentrant rotors was visibly identifiable in arrhythmia movies. These differences between tachy- and fibrillatory arrhythmias suggest that the relative size of reentrant rotors with respect to anatomical obstacles governs the influence of fine-scale anatomy in the maintenance of ventricular arrhythmias in the rabbit. In conclusion, our simulations suggest that fine-scale anatomical features play little apparent role in the maintenance of tachyarrhythmias in the rabbit ventricles and, contrary to experimental reports in larger animals, appear to play only a minor role in the maintenance of fibrillatory arrhythmias. These findings also have important implications in optimising the level of detail required in anatomical computational meshes frequently used in arrhythmia investigations.
Figures
Similar articles
-
Development of an anatomically detailed MRI-derived rabbit ventricular model and assessment of its impact on simulations of electrophysiological function.Am J Physiol Heart Circ Physiol. 2010 Feb;298(2):H699-718. doi: 10.1152/ajpheart.00606.2009. Epub 2009 Nov 20. Am J Physiol Heart Circ Physiol. 2010. PMID: 19933417 Free PMC article.
-
Structural heterogeneity modulates effective refractory period: a mechanism of focal arrhythmia initiation.PLoS One. 2014 Oct 7;9(10):e109754. doi: 10.1371/journal.pone.0109754. eCollection 2014. PLoS One. 2014. PMID: 25291380 Free PMC article.
-
Structural contributions to fibrillatory rotors in a patient-derived computational model of the atria.Europace. 2014 Nov;16 Suppl 4(Suppl 4):iv3-iv10. doi: 10.1093/europace/euu251. Europace. 2014. PMID: 25362167 Free PMC article.
-
Computational rabbit models to investigate the initiation, perpetuation, and termination of ventricular arrhythmia.Prog Biophys Mol Biol. 2016 Jul;121(2):185-94. doi: 10.1016/j.pbiomolbio.2016.06.004. Epub 2016 Jun 19. Prog Biophys Mol Biol. 2016. PMID: 27334789 Free PMC article. Review.
-
Advances in modeling ventricular arrhythmias: from mechanisms to the clinic.Wiley Interdiscip Rev Syst Biol Med. 2014 Mar-Apr;6(2):209-24. doi: 10.1002/wsbm.1256. Epub 2013 Dec 6. Wiley Interdiscip Rev Syst Biol Med. 2014. PMID: 24375958 Free PMC article. Review.
Cited by
-
Comparison of diffusion tensor imaging by cardiovascular magnetic resonance and gadolinium enhanced 3D image intensity approaches to investigation of structural anisotropy in explanted rat hearts.J Cardiovasc Magn Reson. 2015 Apr 29;17(1):31. doi: 10.1186/s12968-015-0129-x. J Cardiovasc Magn Reson. 2015. PMID: 25926126 Free PMC article.
-
Investigation of the Role of Myocyte Orientations in Cardiac Arrhythmia Using Image-Based Models.Biophys J. 2019 Dec 17;117(12):2396-2408. doi: 10.1016/j.bpj.2019.09.041. Epub 2019 Oct 8. Biophys J. 2019. PMID: 31679763 Free PMC article.
-
Anatomically accurate high resolution modeling of human whole heart electromechanics: A strongly scalable algebraic multigrid solver method for nonlinear deformation.J Comput Phys. 2016 Jan 15;305:622-646. doi: 10.1016/j.jcp.2015.10.045. J Comput Phys. 2016. PMID: 26819483 Free PMC article.
-
Myocardial Infarct Segmentation From Magnetic Resonance Images for Personalized Modeling of Cardiac Electrophysiology.IEEE Trans Med Imaging. 2016 Jun;35(6):1408-1419. doi: 10.1109/TMI.2015.2512711. Epub 2015 Dec 25. IEEE Trans Med Imaging. 2016. PMID: 26731693 Free PMC article.
-
Mechanism of reentry induction by a 9-V battery in rabbit ventricles.Am J Physiol Heart Circ Physiol. 2014 Apr 1;306(7):H1041-53. doi: 10.1152/ajpheart.00591.2013. Epub 2014 Jan 24. Am J Physiol Heart Circ Physiol. 2014. PMID: 24464758 Free PMC article.
References
-
- Ai X, Pogwidz SM. Connexin 43 downregulation and dephosphorylation in nonischemic heart failure is associated with enhanced colocalized protein phosphatase type 2a. Circ Res. 2004;96:54–63. - PubMed
-
- Akar F, Nass R, Hahn S, Cingolani E, Shah M, Hesketh G, Disilvestre D, Tunin R, Kass D, Tomaselli G. Dynamic changes in conduction velocity and gap junction properties during development of pacing-induced heart failure. Am J Physiol Heart Circ Physiol. 2007;293:H1223–H1230. - PubMed
-
- Akar F, Spragg D, Tunin R, Kass D, Tomaselli G. Mechanisms underlying conduction slowing and arrhythmogenesis in nonischemic dilated cardiomyopathy. Circ Res. 2004;95:717–725. - PubMed
-
- Banville I, Gray RA, Ideker RE, Smith WM. Shock-induced figure-of-eight reentry in the isolated rabbit heart. Circ Res. 1999;85:742–752. - PubMed
Publication types
MeSH terms
Grants and funding
LinkOut - more resources
Full Text Sources
Medical