Graded loss of tuberin in an allelic series of brain models of TSC correlates with survival, and biochemical, histological and behavioral features
- PMID: 22752306
- PMCID: PMC3441124
- DOI: 10.1093/hmg/dds262
Graded loss of tuberin in an allelic series of brain models of TSC correlates with survival, and biochemical, histological and behavioral features
Abstract
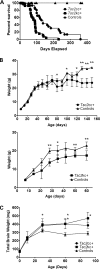
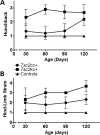
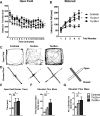
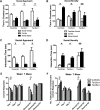
Tuberous sclerosis complex (TSC) is a neurodevelopmental disorder with prominent brain manifestations due to mutations in either TSC1 or TSC2. Here, we describe novel mouse brain models of TSC generated using conditional hypomorphic and null alleles of Tsc2 combined with the neuron-specific synapsin I cre (SynIcre) allele. This allelic series of homozygous conditional hypomorphic alleles (Tsc2(c-del3/c-del3)SynICre(+)) and heterozygote null/conditional hypomorphic alleles (Tsc2(k/c-del3)SynICre(+)) achieves a graded reduction in expression of Tsc2 in neurons in vivo. The mice demonstrate a progressive neurologic phenotype including hunchback, hind limb clasp, reduced survival and brain and cortical neuron enlargement that correlates with a graded reduction in expression of Tsc2 in the two sets of mice. Both models also showed behavioral abnormalities in anxiety, social interaction and learning assays, which correlated with Tsc2 protein levels as well. The observations demonstrate that there are graded biochemical, cellular and clinical/behavioral effects that are proportional to the extent of reduction in Tsc2 expression in neurons. Further, they suggest that some patients with milder manifestations of TSC may be due to persistent low-level expression of functional protein from their mutant allele. In addition, they point to the potential clinical benefit of strategies to raise TSC2 protein expression from the wild-type allele by even modest amounts.
Figures


Similar articles
-
A hypomorphic allele of Tsc2 highlights the role of TSC1/TSC2 in signaling to AKT and models mild human TSC2 alleles.Hum Mol Genet. 2009 Jul 1;18(13):2378-87. doi: 10.1093/hmg/ddp176. Epub 2009 Apr 8. Hum Mol Genet. 2009. PMID: 19357198 Free PMC article.
-
Tsc2 gene inactivation causes a more severe epilepsy phenotype than Tsc1 inactivation in a mouse model of tuberous sclerosis complex.Hum Mol Genet. 2011 Feb 1;20(3):445-54. doi: 10.1093/hmg/ddq491. Epub 2010 Nov 9. Hum Mol Genet. 2011. PMID: 21062901 Free PMC article.
-
Localization of tuberous sclerosis 2 mRNA and its protein product tuberin in normal human brain and in cerebral lesions of patients with tuberous sclerosis.Brain Pathol. 1996 Oct;6(4):367-75. doi: 10.1111/j.1750-3639.1996.tb00866.x. Brain Pathol. 1996. PMID: 8944308
-
Tuberous sclerosis complex: molecular pathogenesis and animal models.Neurosurg Focus. 2006 Jan 15;20(1):E4. doi: 10.3171/foc.2006.20.1.5. Neurosurg Focus. 2006. Retraction in: Neurosurg Focus. 2006;21(1):e17. PMID: 16459994 Retracted. Review.
-
Tuberous sclerosis complex and DNA repair.Adv Exp Med Biol. 2010;685:84-94. doi: 10.1007/978-1-4419-6448-9_8. Adv Exp Med Biol. 2010. PMID: 20687497 Review.
Cited by
-
Altered cerebellar connectivity in autism and cerebellar-mediated rescue of autism-related behaviors in mice.Nat Neurosci. 2017 Dec;20(12):1744-1751. doi: 10.1038/s41593-017-0004-1. Epub 2017 Oct 30. Nat Neurosci. 2017. PMID: 29184200 Free PMC article.
-
A circuitry and biochemical basis for tuberous sclerosis symptoms: from epilepsy to neurocognitive deficits.Int J Dev Neurosci. 2013 Nov;31(7):667-78. doi: 10.1016/j.ijdevneu.2013.02.008. Epub 2013 Feb 26. Int J Dev Neurosci. 2013. PMID: 23485365 Free PMC article. Review.
-
Tuberous Sclerosis: A New Frontier in Targeted Treatment of Autism.Neurotherapeutics. 2015 Jul;12(3):572-83. doi: 10.1007/s13311-015-0359-5. Neurotherapeutics. 2015. PMID: 25986747 Free PMC article. Review.
-
A novel mouse model of hemangiopericytoma due to loss of Tsc2.Hum Mol Genet. 2018 Dec 15;27(24):4169-4175. doi: 10.1093/hmg/ddy289. Hum Mol Genet. 2018. PMID: 30124871 Free PMC article.
-
Inactivation of Tsc2 in Abcg2 lineage-derived cells drives the appearance of polycystic lesions and fibrosis in the adult kidney.Am J Physiol Renal Physiol. 2019 Nov 1;317(5):F1201-F1210. doi: 10.1152/ajprenal.00629.2018. Epub 2019 Aug 28. Am J Physiol Renal Physiol. 2019. PMID: 31461347 Free PMC article.
References
-
- Kwiatkowski D.J., Thiele E.A., Whittemore V.H. Tuberous Sclerosis Complex. Weinheim, Germany: Wiley-VCH; 2010.
-
- Thiele E.A., Jozwiak S. Natural history of tuberous sclerosis complex and overview of manifestations. In: Kwiatkowski D.J., Whittemore V.H., Thiele E.A., editors. Tuberous Sclerosis Complex. Weinheim, Germany: Wiley-VCH; 2010. pp. 11–20.
-
- Winterkorn E.B., Pulsifer M.B., Thiele E.A. Cognitive prognosis of patients with tuberous sclerosis complex. Neurology. 2007;68:62–64. doi:10.1212/01.wnl.0000250330.44291.54. - DOI - PubMed
-
- Tierney K.M., McCartney D.L., Serfontein J.R., de Vries P.J. Neuropsychological attention skills and related behaviours in adults with tuberous sclerosis complex. Behav. Genet. 2011;41:437–444. doi:10.1007/s10519-010-9423-4. - DOI - PubMed
-
- Yates J.R., Maclean C., Higgins J.N., Humphrey A., le Marechal K., Clifford M., Carcani-Rathwell I., Sampson J.R., Bolton P.F. The Tuberous Sclerosis 2000 Study: presentation, initial assessments and implications for diagnosis and management. Arch. Dis. Child. 2011;96:1020–1025. doi:10.1136/adc.2011.211995. - DOI - PubMed
Publication types
MeSH terms
Substances
Grants and funding
LinkOut - more resources
Full Text Sources
Medical
Molecular Biology Databases

