. 2012 Jul 2;13(7):R59.
doi: 10.1186/gb-2012-13-7-r59.

E2F mediates enhanced alternative polyadenylation in proliferation

E2F mediates enhanced alternative polyadenylation in proliferation

Ran Elkon et al. Genome Biol. .

Abstract

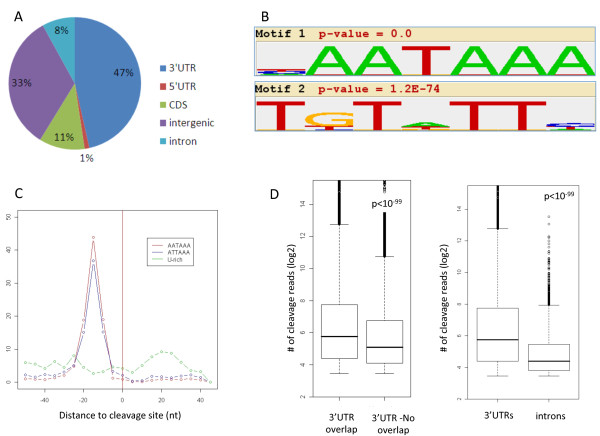
Background: The majority of mammalian genes contain multiple poly(A) sites in their 3' UTRs. Alternative cleavage and polyadenylation are emerging as an important layer of gene regulation as they generate transcript isoforms that differ in their 3' UTRs, thereby modulating genes' response to 3' UTR-mediated regulation. Enhanced cleavage at 3' UTR proximal poly(A) sites resulting in global 3' UTR shortening was recently linked to proliferation and cancer. However, mechanisms that regulate this enhanced alternative polyadenylation are unknown.

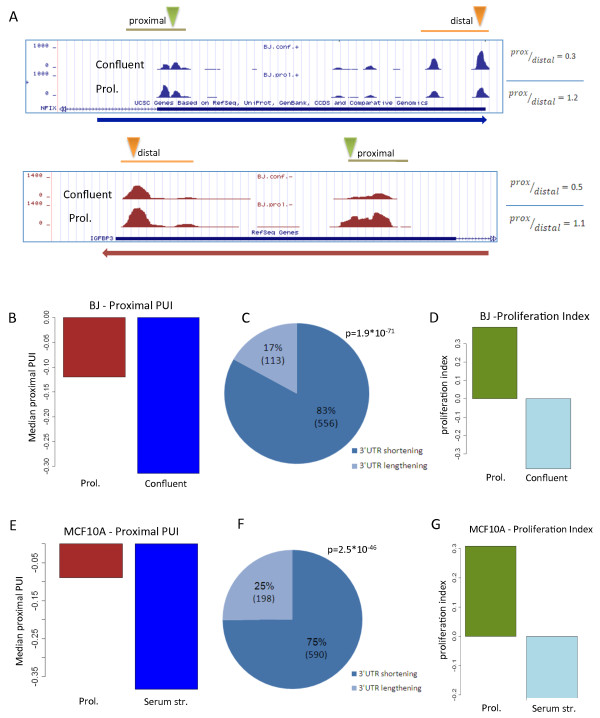
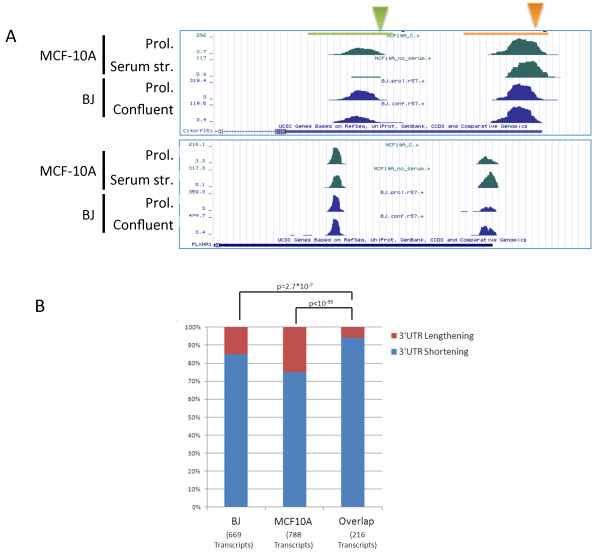
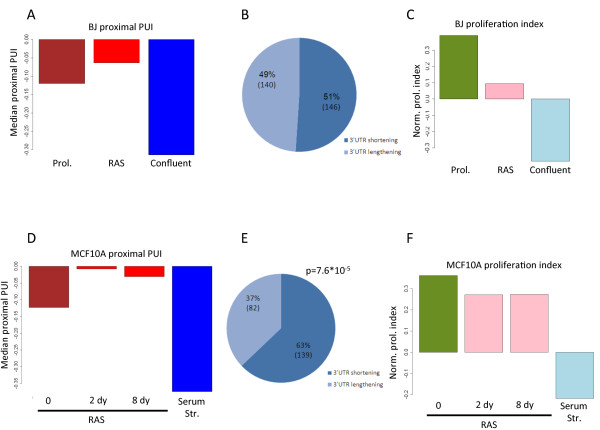
Results: Here, we explored, on a transcriptome-wide scale, alternative polyadenylation events associated with cellular proliferation and neoplastic transformation. We applied a deep-sequencing technique for identification and quantification of poly(A) sites to two human cellular models, each examined under proliferative, arrested and transformed states. In both cell systems we observed global 3' UTR shortening associated with proliferation, a link that was markedly stronger than the association with transformation. Furthermore, we found that proliferation is also associated with enhanced cleavage at intronic poly(A) sites. Last, we found that the expression level of the set of genes that encode for 3'-end processing proteins is globally elevated in proliferation, and that E2F transcription factors contribute to this regulation.

Conclusions: Our results comprehensively identify alternative polyadenylation events associated with cellular proliferation and transformation, and demonstrate that the enhanced alternative polyadenylation in proliferative conditions results not only in global 3' UTR shortening but also in enhanced premature cleavage in introns. Our results also indicate that E2F-mediated co-transcriptional regulation of 3'-end processing genes is one of the mechanisms that links enhanced alternative polyadenylation to proliferation.


Figures

Figure 1
Figure 1
Identification of poly(A) sites using 3'-Seq. (a) Distribution of the cleavage sites (CSs) identified by 3'-Seq into genomic regions. (b) Enriched motifs identified in the region spanning ±50 nucleotides with respect to the CSs that mapped to the 3' UTR. The top scoring motif corresponds to the canonical PAS and the second top corresponds to the auxiliary U-rich motif. (c) Location distribution of the enriched signals with respect to the position of the mapped cleavage sites. (d) Comparison between the strength of 3' UTR CSs (estimated by the number of sequenced reads that support their call) that either overlapped or did not overlap polyA-DB records (left), and between CSs that mapped to 3' UTR or introns (right). CDS, coding sequence; nt, nucleotide.
Figure 2
Figure 2
Extensive 3' UTR shortening in proliferative cells. (a) Two examples of transcripts that showed enhanced usage of proximal CSs in BJ proliferating cells compared to confluent ones. The blue and red plots correspond to genes encoded on the positive and reverse strands, respectively. Proximal and distal CSs are indicated by green and orange triangles, respectively. Ratios between proximal and distal peak levels are indicated to the right. (b) The proximal polyadenylation site usage index (proximal PUI) provides a global measure for the relative usage of proximal CSs in the examined conditions (Materials and methods). The transition from proliferation to confluent state resulted in a strong decrease in the proximal PUI. (c) A pie chart showing the distribution of transcripts that underwent significant change in CS usage in the transition from proliferation to confluent. In dark and light blue are the proportions of transcripts with shortened or lengthened 3' UTRs in the proliferative state, respectively. (d) The proliferative status of proliferating and confluent BJ cells was measured using a proliferation index, which is based on the relative expression of cell-cycle related genes. (e-g) Same as (b-d), but here proliferating and serum-deprived MCF10A cells were analyzed.
Figure 3
Figure 3
Core set of genes with shortened 3' UTRs in proliferative state. (a) Examples of transcripts with shortened 3' UTRs in the proliferative state compared to the arrested one in both BJ and MCF10A cells. Proximal and distal CSs are indicated by green and orange triangles, respectively. (b) The set of 216 transcripts that showed consistent change in 3' UTR length in both BJ and MCF10A cells was significantly enriched for genes with shortened 3' UTRs in the proliferative state (the increase from 83% and 75% to 94% is highly significant; P-values calculated using geometric tail).
Figure 4
Figure 4
Enhanced cleavage at intronic poly(A) sites in proliferation. (a) Two examples of genes that showed significant enhancement of cleavage at intronic poly(A) sites in proliferative MCF10A cells compared to serum-starved ones. Ratios between intronic and 3' UTR peak levels are indicated to the right. (b) Global enhancement of cleavage at intronic sites was associated with proliferation in both BJ cells (left, proliferative compared to confluent cells) and MCF10A cells (right, proliferative compared to serum starved cells). (c) Enhanced cleavage at intronic sites in proliferation was validated using 3'-end qRT-PCR applied to intronic and 3' UTR distal poly(A) sites of RNF220 and FAM70B, measured in MCF10A under proliferative and serum-starved conditions. The figure shows means (± standard deviation) of three independent experiments (for both genes, **P < 0.005; one-tailed t-test).
Figure 5
Figure 5
Relationship between APA and transformation. (a) Proximal PUIs calculated for proliferating, RAS-transformed and confluent BJ cells. (b) Distribution of APA events induced by RAS transformation according to net effect on transcript 3' UTR length. (c) Proliferation index calculated for proliferating, RAS-transformed and confluent BJ cells. (d) Proximal PUIs calculated for proliferating, RAS-transformed (2 and 8 days after RASG12V induction) and serum-starved MCF10A cells. (e) Distribution of APA events that were consistently induced by RAS transformation at both 2 days and 8 days, according to net effect on transcript 3' UTR length. (f) Proliferation index calculated for proliferating, RAS-transformed and serum-starved MCF10A cells.
Figure 6
Figure 6
E2F-mediated regulation of APA in proliferation. (a) Comparison of the distribution of fold-change (in log2) in expression levels between confluent and proliferative cells calculated over two sets of genes: a target set that contained the 3'-end processing genes and a background set that contained all the rest of genes expressed in BJ cells (P-value calculated using Wilcoxon test). (b) The top scoring motif identified by de novo motif discovery analysis applied to the set of promoters of the 3'-end processing genes matched the binding signature of E2F (motif accession number in TRANSFAC DB: M00430). (c) Normalized expression levels (determined from the 3'-seq data) of E2F1 and E2F2 in proliferating and confluent BJ cells. (d) Schematic map of the core machineries of polyadenylation site recognition and 3'-end cleavage. In this map, nodes correspond to either protein-coding genes (violet nodes) or protein complexes (green nodes), and edges correspond to either regulatory links (blue edges) or association links between complexes and their members (green edges). The fold-change in expression in the transition from proliferating to confluent BJ cells is indicated by the horizontal bar at the top of each node (green corresponds to down-regulation, yellow to no-change and gray to gene not expressed in our dataset). Genes in this network whose promoter was found to be bound by either E2F1 [26] or E2F4 [27] are indicated by an orange and blue vertical bars to their left. (The map was created using the SPIKE knowledgebase of signaling pathways [36].) (e) Effect of knocking down E2F1 on promoter activity of eight 3'-end processing genes assessed using reporter assays. MCM2 served as positive control and an artificial p53 promoter was used as a negative one. *P < 0.05, **P < 0.01. Error bars represent SEM. (f) The effect of knocking down E2F1+2 on the expression levels of three core cleavage factors in BJ cells was examined using qPCR (results shown are mean ± standard deviation based on triplicates in the case of E2F1 and E2F2, and on five replicates for the three cleavage transcripts). In all cases, the reduction in transcript level is statistically significant (P < 0.01; one-tail t-test)). (g) The effect of knocking down E2F1+2 on the relative usage of 3' UTR proximal and distal CSs in three transcripts that showed enhanced usage of the proximal CSs in proliferation was examined using 3'-qPCR (Materials and methods). In all three cases examined, reducing E2F levels increased the relative cleavage at the distal site (namely, reduced the cleavage at the proximal one). Results shown are based on duplicates; in all cases, P < 0.05, one-tail t-test). (h) A schematic model illustrating the E2F-mediated regulation of mRNA 3'end processing enzymes and its effect on APA.

Similar articles

Cited by

References

    1. Colgan DF, Manley JL. Mechanism and regulation of mRNA polyadenylation. Genes Dev. 1997;11:2755–2766. doi: 10.1101/gad.11.21.2755. - DOI - PubMed
    1. Hu J, Lutz CS, Wilusz J, Tian B. Bioinformatic identification of candidate cis-regulatory elements involved in human mRNA polyadenylation. RNA. 2005;11:1485–1493. doi: 10.1261/rna.2107305. - DOI - PMC - PubMed
    1. Beaudoing E, Freier S, Wyatt JR, Claverie JM, Gautheret D. Patterns of variant polyadenylation signal usage in human genes. Genome Res. 2000;10:1001–1010. doi: 10.1101/gr.10.7.1001. - DOI - PMC - PubMed
    1. Shi Y, Di Giammartino DC, Taylor D, Sarkeshik A, Rice WJ, Yates JR, Frank J, Manley JL. Molecular architecture of the human pre-mRNA 3' processing complex. Mol Cell. 2009;33:365–376. doi: 10.1016/j.molcel.2008.12.028. - DOI - PMC - PubMed
    1. Neilson JR, Sandberg R. Heterogeneity in mammalian RNA 3' end formation. Exp Cell Res. 2010;316:1357–1364. doi: 10.1016/j.yexcr.2010.02.040. - DOI - PMC - PubMed

Publication types

MeSH terms