. 2012 Jun 27;32(26):9023-34.
doi: 10.1523/JNEUROSCI.0918-12.2012.

Dual control of dopamine synthesis and release by presynaptic and postsynaptic dopamine D2 receptors

Affiliations

Dual control of dopamine synthesis and release by presynaptic and postsynaptic dopamine D2 receptors

Andrea Anzalone et al. J Neurosci. .

Abstract

Dysfunctions of dopaminergic homeostasis leading to either low or high dopamine (DA) levels are causally linked to Parkinson's disease, schizophrenia, and addiction. Major sites of DA synthesis are the mesencephalic neurons originating in the substantia nigra and ventral tegmental area; these structures send major projections to the dorsal striatum (DSt) and nucleus accumbens (NAcc), respectively. DA finely tunes its own synthesis and release by activating DA D2 receptors (D2R). To date, this critical D2R-dependent function was thought to be solely due to activation of D2Rs on dopaminergic neurons (D2 autoreceptors); instead, using site-specific D2R knock-out mice, we uncover that D2 heteroreceptors located on non-DAergic medium spiny neurons participate in the control of DA levels. This D2 heteroreceptor-mediated mechanism is more efficient in the DSt than in NAcc, indicating that D2R signaling differentially regulates mesolimbic- versus nigrostriatal-mediated functions. This study reveals previously unappreciated control of DA signaling, shedding new light on region-specific regulation of DA-mediated effects.


Figures

Figure 1.
Figure 1.
Generation and characterization of D2Rfloxflox/En1Cre/+ and D2Rfloxflox/D1Cre/+ mice. A, Scheme representing the strategy to generate D2Rfloxflox mice. ◁, Lox P site, dots indicate the probe used for genotyping. B, Representative Southern blot of genomic DNA from D2R+/+, D2Rfloxflox, and D2Rfloxflox/En1Cre/+ digested with HindIII and hybridized with 32P-labeled D2R and CRE probes; the genotype and size of the obtained fragments are as indicated. C, In situ hybridization using the D2R Exon2 probe showing selective ablation of D2R in SN and VTA (white arrowheads) for the D2Rfloxflox/En1Cre/+ and in the CPu (white lines) and NAcc for the D2Rfloxflox/D1Cre/+ mice. D, Scatchard analysis of the saturation isotherm for binding of the D2R antagonist [3H]-spiperone to striatal membranes from D2Rfloxflox (■; Bmax = 884 ± 25 fmol/mg protein; Kd = 171 ± 49 pm) and D2Rfloxflox/En1Cre/+ (□; Bmax = 690 ± 37 fmol/mg protein; Kd = 132 ± 21 pm) (n = 3). E, Scatchard analysis of the saturation isotherm for binding of the D2R antagonist [3H]-spiperone to striatal membranes from D2Rfloxflox (■; Bmax = 875 ± 28 fmol/mg protein; Kd = 184 ± 52 pm) and D2Rfloxflox/D1Cre/+ (▿; Bmax = 259 ± 35 fmol/mg protein; Kd = 198 ± 58 pm). Values are given ± SEM (n = 3). F, Scatchard analysis of the saturation isotherm for binding of the D1 DA receptor antagonist [3H]-SCH23390 in striatal extracts from D2Rfloxflox (■; Bmax = 1703 ± 204 fmol/mg protein; Kd = 297 ± 93 pm) and D2Rfloxflox/En1Cre/+ (□; Bmax = 1682 ± 168 fmol/mg protein; Kd = 354 ± 115 pm) mice (n = 3). G, Scatchard analysis of the saturation isotherm for binding of the D1 DA receptor antagonist [3H]-SCH23390 in striatal extracts from D2Rfloxflox (■; Bmax = 1695 ± 269 fmol/mg protein; Kd = 278 ± 85 pm) and D2Rfloxflox/D1Cre/+ (▿; Bmax = 1686 ± 198 fmol/mg protein; Kd = 354 ± 104 pm). H, Double in situ hybridizations of sections from D2Rfloxflox and D2Rfloxflox/D1Cre/+ mice using a 35S-labeled D2R-specific exon 2 probe together with the DIG-labeled Gad1 or ChAT probes, as indicated. Magnification 40×.
Figure 2.
Figure 2.
Loss of D2 autoreceptors or heteroreceptors differently affects motor behavior. A, Locomotion and rearing activity of D2Rfloxflox (black bars) and D2Rfloxflox/En1Cre/+ (white bars) mice in the home cage (n = 9–10). No difference was observed between genotypes. Student's t test, p > 0.05. B, Locomotion and rearing activity of D2Rfloxflox (black bars) and D2Rfloxflox/D1Cre/+ (gray bars) mice in the home cage (n = 9–10). Student's t test, ***p < 0.001. C, Motor coordination as assessed using the rotarod test. Values represent the average ± SEM of fall latency (s) across 4 d, D2Rfloxflox (■) and D2Rfloxflox/En1Cre/+ (□) mice. Both genotypes showed similar latencies to fall (F(3,36) = 1.178, p > 0.05) and improved their performance with time (F(3,36) = 14.426, p < 0.001). D, Motor coordination as assessed using the rotarod test. Values represent the average ± SEM of fall latency (s) across 4 d, D2Rfloxflox (■) and D2Rfloxflox/D1Cre/+ (▩) mice. D2Rfloxflox/D1Cre/+ showed significantly shorter latencies to fall (F(3,34) = 6.239 p < 0.05). E, Locomotion and rearing activity in the open field of D2Rfloxflox (black bars) and D2Rfloxflox/En1Cre/+ (white bars) (n = 9–10). Student's t test, *p < 0.05 and rearing **p < 0.01. F, Locomotion and rearing activity in the open field of D2Rfloxflox (black bars) and D2Rfloxflox/D1Cre/+ (gray bars) (n = 9–10). Student's t test, **p < 0.01, ***p < 0.001. G, Motor activity after acute cocaine injection (15 mg/kg) recorded for 30 min of D2Rfloxflox (black bars) and D2Rfloxflox/En1Cre/+ (white bars). Two-way ANOVA Treatment × Genotype: F(1,34) = 5.249, p < 0.05. Saline versus treated: *p < 0.05, **p < 0.01. D2Rfloxflox/En1Cre/+ versus D2Rfloxflox: #p < 0.05. H, Motor activity after acute cocaine injection (15 mg/kg) recorded for 30 min for D2Rfloxflox (black bars) and D2Rfloxflox/D1Cre/+ (gray bars) mice. Two-way ANOVA Treatment × Genotype: F(1,49) = 5.759, p < 0.05. Saline versus treated: *p < 0.05. D2Rfloxflox/D1Cre/+ versus D2Rfloxflox: #p < 0.05, ###p < 0.001.
Figure 3.
Figure 3.
Behavioral effects of D2-like agonists and antagonists in D2Rfloxflox/En1Cre/+ and D2Rfloxflox/D1Cre/+ mice. A, Haloperidol-induced catalepsy in D2Rfloxflox (black bars) and D2Rfloxflox/En1Cre/+ (white bars) mice. Two-way ANOVA Treatment effect (F(3,81) = 135.637, p < 0.001) and a trend toward genotype effect (F(1,81) = 3.906, p = 0.052). B, Haloperidol-induced catalepsy in D2Rfloxflox (black bars) versus D2Rfloxflox/D1Cre/+ (gray bars) mice. Two-way ANOVA Genotype × Treatment effect (F(2,57) = 14.635, p < 0.001). C, Differential quinpirole induced motor sedation in D2Rfloxflox (black bars) versus D2Rfloxflox/En1Cre/+ (white bars) mice. Two-way ANOVA significant Genotype (F(1,48) = 18.967, p < 0.001) and Treatment effects (F(2,48) = 17.878, p < 0.001). D, Quinpirole induced sedation in D2Rfloxflox (black bars) versus D2Rfloxflox/D1Cre/+ (gray bars) mice. Two-way ANOVA: Genotype × Treatment (F(2,37) = 8.284 p < 0.01). Saline versus treated *p < 0.05; **p < 0.01; ***p < 0.001; D2Rfloxflox/En1Cre/+ treated versus D2Rfloxflox treated #p < 0.05; ##p < 0.01. D2Rfloxflox/D1Cre/+ treated versus D2Rfloxflox treated, +++p < 0.001.
Figure 4.
Figure 4.
Electrophysiological characterization of SNc and VTA neurons of D2Rfloxflox/En1Cre/+ mice. A, Loss of presynaptic D2 autoreceptor-mediated inhibition of firing in SNc and VTA of D2Rfloxflox/En1Cre/+ mice compared with control mice. B, Normal GABAB-mediated inhibition of firing in both genotypes (representative examples). C, Percentage of firing inhibition by quinpirole (2 μm) in SNc (left) and VTA (right) in D2Rfloxflox (black bars) and D2Rfloxflox/En1Cre/+ (white bars) (n = 4 for each condition; for both regions: p < 0.05 D2Rfloxflox vs D2Rfloxflox/En1Cre/+, ranked sum test). D, Percentage of firing inhibition by baclofen (2 μm) in SNc (left; n = 4 D2Rfloxflox/En1Cre/+, n = 3 D2Rfloxflox) and VTA (right; n = 4 for both genotypes) [not significant D2Rfloxflox (black bars) vs D2Rfloxflox/En1Cre/+ (white bars) in either region].
Figure 5.
Figure 5.
Determination of DA and its metabolites in D2Rfloxflox, D2Rfloxflox/En1Cre/+, and D2Rfloxflox/D1Cre/+ mice. Values indicate the percentage of DA, DOPAC, and HVA with respect to D2Rfloxflox levels, which were arbitrarily set at 100%. A–C, Determination were made by HPLC on extracts from tissue punches of DSt (A), NAcc (B), and PFC (C) from D2Rfloxflox (black bars) and D2Rfloxflox/En1Cre/+ (white bars). D–F, DSt (D), NAcc (E), and PFC (F) from D2Rfloxflox (black bars) and D2Rfloxflox/D1Cre/+ (gray bars). Statistical analyses were performed by the Student's t test: *p < 0.05; **p < 0.01 (n = 7–8).
Figure 6.
Figure 6.
Characterization of DA overflow by CV in D2Rfloxflox/En1Cre/+ and D2Rfloxflox/D1Cre/+ mice. Ablation of either D2 autoreceptors or D2 heteroreceptors in MSNs affects DA overflow. Analysis of DA overflow by CV. A, Representative traces for cyclic voltammetry experiments in the DSt of D2Rfloxflox and D2Rfloxflox/En1Cre/+, as indicated. Scale bars: vertical, 0.15 μm; horizontal, 2.0 s. B, Single-pulse stimulation in D2Rfloxflox/En1Cre/+ mice (white bar) (n = 19–20). C, Quinpirole (Quin)-mediated inhibition of DA overflow in: D2Rfloxflox/En1Cre/+ mice (○, 50 nm; □, 500 nm) and D2Rfloxflox (●, 50 nm; ■, 500 nm) (50 nm: n = 7, F(1,261) = 8.46, p = 0.0039; 500 nm: n = 7–8, F(1,204) = 23.52, p < 0.001). D, Representative traces for cyclic voltammetry experiments in the DSt of D2Rfloxflox and D2Rfloxflox/D1Cre/+, as indicated. Scale bars: vertical, 0.15 μm; horizontal, 2.0 s. E, Single-pulse stimulation in D2Rfloxflox/D1Cre/+ mice (n = 35–37). F, Quinpirole-mediated inhibition of DA overflow in D2Rfloxflox/D1Cre/+ (▩) and D2Rfloxflox (■) mice (500 nm: n = 9–10, F(1,274) = 33.23, p < 0.0001). Two-tailed unpaired t test was used in B and E. In C and F, significance was determined by F test, which compares the individual bottom values obtained for each genotype from a nonlinear regression with an average bottom value obtained from a global regression using both genotypes simultaneously. *p < 0.05, ***p < 0.001.
Figure 7.
Figure 7.
Analysis of DA reuptake in D2Rfloxflox/En1Cre/+ and D2Rfloxflox/D1Cre/+ mice. Only D2Rfloxflox/En1Cre/+ mice present changes in DAT function, whereas D2Rfloxflox/D1Cre/+ do not, as assessed by the analysis of the decay parameters and the nomifensine-mediated increase of DA overflow. Black bars, D2Rfloxflox; white bars, D2Rfloxflox/En1Cre/+; gray bars, D2Rfloxflox/D1Cre/+. A, B, Representative traces for amperometric experiments in the DSt; the genotype corresponding to each trace is indicated. Stimulation artifacts were digitally removed to improve visualization. Scale bars: A: vertical, 20 pA; horizontal, 0.3 s. B: vertical, 240 pA; horizontal, 0.3 s. C, Decay parameters were calculated from the DA overflow spikes obtained from CV experiments showing that D2Rfloxflox/En1Cre/+ mice (white bars) exhibit a significant change in spike width (t1/2) compared with D2Rfloxflox mice (black bars). The decay time from the 75% to 25% of the spike (fall time) and the decay constant (τ) presented no changes (n = 16–17). Decay parameters calculated by AMP show a minimal but not significant decrease in the fall time and decay constant (p = 0.08 and 0.07, respectively; n = 10) in D2Rfloxflox/En1Cre/+ mice. D, Decay parameters calculated from the DA overflow spikes in D2Rfloxflox/D1Cre/+ mice (gray bars) showed no significant changes in spike width, decay time, or decay constant (CV: n = 13–14; AMP: n = 10) compared with D2Rfloxflox mice (black bars). E, DA overflow measured in D2Rfloxflox/En1Cre/+ mice (□) during nomifensine-mediated blockade of DAT does not reach the same levels of WT mice (■) (nomifensine: 5 μm; n = 4; increase in [DA], D2Rfloxflox: 2.36 μm; D2Rfloxflox/En1Cre/+: 0.92). F, Nomifensine-mediated blockade of DAT induces a significant increase in DA overflow in D2Rfloxflox/En1Cre/+ mice (□) when compared with the baseline-normalized response with respect to WT mice (■) (nomifensine: 5 μm; n = 4; increase in [DA], D2Rfloxflox: ∼2-fold; D2Rfloxflox/En1Cre/+: ∼2.7-fold; F(1,89) = 8.61, p = 0.004). Maximal DA-overflow concentration and normalized response were calculated using a nonlinear regression that takes in consideration the plateau and the rising independently. In F, significance was determined by an F test, which compares the individual top values obtained for each genotype from the nonlinear regression with an average top value obtained from a global regression using both genotypes simultaneously. Two-tailed unpaired t test with Welch's correction was used in C and D.
Figure 8.
Figure 8.
DA release probability in D2Rfloxflox/En1Cre/+ and D2Rfloxflox/D1Cre/+ compared with WT mice. Ablation of D2 autoreceptors increases release probability at both low and high frequencies, whereas ablation of D2 heteroreceptors in MSNs increases release probability only at low frequencies in the DSt. A, Paired-pulse analysis (CV: 0.017–0.2 Hz, n = 4–5; AMP: 1 and 2 Hz, n = 6–7) in D2Rfloxflox/En1Cre/+ mice (□) displayed enhanced recovery at 1 and 2 Hz compared with WT littermates (■) [AMP (Genotype): F(1,22) = 28.46, p < 0.0001]. B, Paired-pulse analysis (CV: n = 6; AMP: n = 12–13) in D2Rfloxflox/D1Cre/+ mice (▩) displayed enhanced recovery only at 1 Hz compared with WT littermates (■) [AMP (Interaction): F(1,37) = 12.81, p = 0.001]. C, Train of pulses at 20 Hz displayed enhanced DA overflow in D2Rfloxflox/En1Cre/+ mice (white bars) with respect to control littermates (black bars) (CV; n = 6–12; genotype: F(1,32) = 18.98, p = 0.0001). D, Train of pulses at 20 Hz displayed no changes in DA overflow in D2Rfloxflox/D1Cre/+ mice (gray bars) compared with controls (black bars) (CV; n = 8–12; genotype: F(1,36) = 2.76, p = 0.11). E, Train of pulses at 20 Hz displayed enhanced DA overflow in the shell of the NAcc of D2Rfloxflox/En1Cre/+ (white bars) versus control littermates (black bars) (n = 6–9; F(1,29) = 21.37, p < 0.0001). F, Comparisons of the ratios D2Rfloxflox/En1Cre/+/D2Rfloxflox of values of DA-overflow produced by a train of pulses between the DSt and the shell of NAcc for five and 10 pulses (□, DSt; formula image
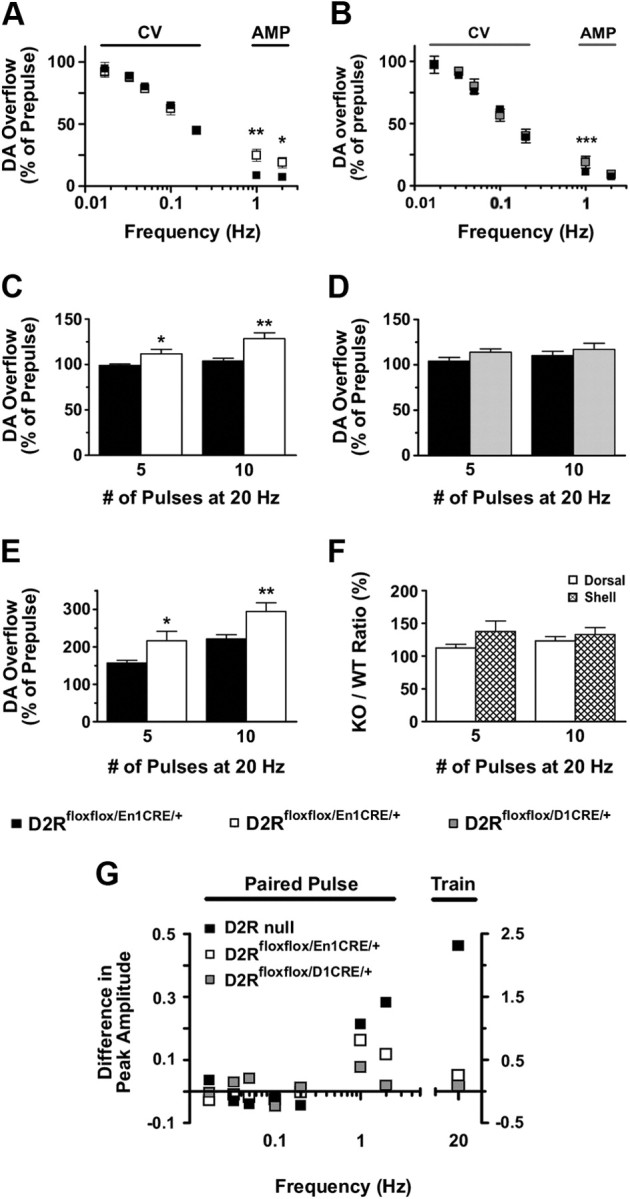
, shell NAcc; F(1,27) = 4.34, p = 0.046). G, Comparison of the DA release probability in D2R-null (■), D2Rfloxflox/En1Cre/+ (□), and D2Rfloxflox/D1Cre/+ (▩) mice. Summary diagram of the difference between the D2R-null, D2Rfloxflox/En1Cre/+, and D2Rfloxflox/D1Cre/+ mice (as indicated) compared with their respective WT controls in the paired-pulse and train of pulses experiments. The frequencies represent interpulse intervals of 60, 30, 20, 10, 5, 1, 0.5, and 0.05 s. Two-way ANOVA with Bonferroni's post hoc test for genotype was used in all panels. *p < 0.05, **p < 0.01, ***p < 0.001.
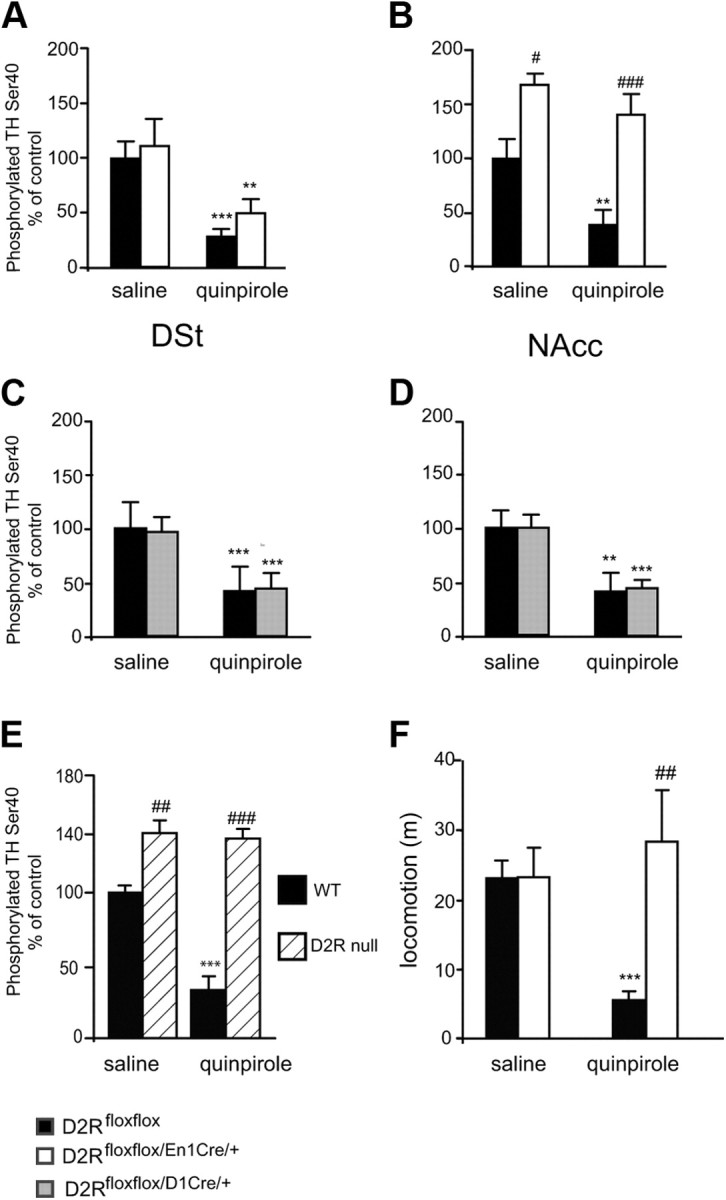
Figure 9.
Figure 9.
Effect of loss of D2 autoreceptors or heteroreceptors on TH phosphorylation. Western blot analyses of pTH-Ser40 levels in DSt and NAcc extracts (30 μg/sample) of D2Rfloxflox/En1Cre/+, D2Rfloxflox/D1Cre/+, and D2Rfloxflox mice treated either with saline or with quinpirole (0.2 mg/kg), as indicated. Values represent the ratio of pTH-Ser40/total TH; the values of the ratio from saline-treated D2Rfloxflox mice were arbitrarily set at 100%. A, Ratios obtained from analyses of DSt extracts from D2Rfloxflox (black bars) and D2Rfloxflox/En1Cre/+ (white bars). Two-way ANOVA shows no genotype effect (F(1,17) = 1.848, p > 0.05). B, Same as in A for NAcc extracts, D2Rfloxflox (black bars) and D2Rfloxflox/En1Cre/+ (white bars). Two-way ANOVA shows Genotype effect: F(1,17) = 33.126 p < 0.001. C, Same analysis as in A, but using DSt extracts from D2Rfloxflox (black bars) and D2Rfloxflox/D1Cre/+ (gray bars). Two-way ANOVA no Genotype effect: F(1,18) = 1.984 p > 0.05. D, Same analysis as in B but using NAcc extracts from D2Rfloxflox (black bars) and D2Rfloxflox/D1Cre/+ (gray bars). Two-way ANOVA no Genotype effect: F(1,18) = 1.976 p > 0.05. Values are mean ± SEM. *p < 0.05, **p < 0.01, ***p < 0.001 versus saline control. D2Rfloxflox versus D2Rfloxflox/En1Cre/+, #p < 0.05, ##p < 0.01. E, Ratio obtained from analyses of DSt extracts (30 μg/sample) from D2R-null mice treated either with saline or quinpirole (0.2 mg/kg), genotypes are as indicated. Values represent the ratio of pTH-Ser40/total TH; the values of the ratio from saline-treated D2R mice were arbitrarily set at 100%. A significant increase of pTH-Ser40 was observed in D2R-null mice, which was not affected by quinpirole treatment compared with WT extracts. Treatment × Genotype: F(1,17) = 34.142, p < 0.01.***p < 0.001 versus saline; WT versus D2R−/−: ##p < 0.01; ###p < 0.001. F, D2Rfloxflox (black bars) and D2Rfloxflox/En1Cre/+ (white bars) treated either with saline or quinpirole (0.2 mg/kg), as indicated, were exposed to the open field for 30 min. While quinpirole induced motor sedation in D2Rfloxflox mice, no effect of this drug was observed in D2Rfloxflox/En1Cre/+ mice under these conditions. Treatment × Genotype: F(1,33) = 10.94. Saline versus quinpirole: ***p < 0.001; D2Rfloxflox treated versus D2Rfloxflox/En1Cre/+ treated: ##p < 0.01.

Similar articles

Cited by

References

    1. Aragona BJ, Cleaveland NA, Stuber GD, Day JJ, Carelli RM, Wightman RM. Preferential enhancement of dopamine transmission within the nucleus accumbens shell by cocaine is attributable to a direct increase in phasic dopamine release events. J Neurosci. 2008;28:8821–8831. - PMC - PubMed
    1. Bäckman CM, Malik N, Zhang Y, Shan L, Grinberg A, Hoffer BJ, Westphal H, Tomac AC. Characterization of a mouse strain expressing Cre recombinase from the 3′ untranslated region of the dopamine transporter locus. Genesis. 2006;44:383–390. - PubMed
    1. Baik JH, Picetti R, Saiardi A, Thiriet G, Dierich A, Depaulis A, Le Meur M, Borrelli E. Parkinsonian-like locomotor impairment in mice lacking dopamine D2 receptors. Nature. 1995;377:424–428. - PubMed
    1. Bamford NS, Zhang H, Schmitz Y, Wu NP, Cepeda C, Levine MS, Schmauss C, Zakharenko SS, Zablow L, Sulzer D. Heterosynaptic dopamine neurotransmission selects sets of corticostriatal terminals. Neuron. 2004a;42:653–663. - PubMed
    1. Bamford NS, Robinson S, Palmiter RD, Joyce JA, Moore C, Meshul CK. Dopamine modulates release from corticostriatal terminals. J Neurosci. 2004b;24:9541–9552. - PMC - PubMed

Publication types

MeSH terms