In vivo effects of histone H3 depletion on nucleosome occupancy and position in Saccharomyces cerevisiae
- PMID: 22737086
- PMCID: PMC3380831
- DOI: 10.1371/journal.pgen.1002771
In vivo effects of histone H3 depletion on nucleosome occupancy and position in Saccharomyces cerevisiae
Abstract
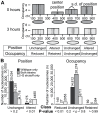
Previous studies in Saccharomyces cerevisiae established that depletion of histone H4 results in the genome-wide transcriptional de-repression of hundreds of genes. To probe the mechanism of this transcriptional de-repression, we depleted nucleosomes in vivo by conditional repression of histone H3 transcription. We then measured the resulting changes in transcription by RNA-seq and in chromatin organization by MNase-seq. This experiment also bears on the degree to which trans-acting factors and DNA-encoded elements affect nucleosome position and occupancy in vivo. We identified ∼60,000 nucleosomes genome wide, and we classified ∼2,000 as having preferentially reduced occupancy following H3 depletion and ∼350 as being preferentially retained. We found that the in vivo influence of DNA sequences that favor or disfavor nucleosome occupancy increases following histone H3 depletion, demonstrating that nucleosome density contributes to moderating the influence of DNA sequence on nucleosome formation in vivo. To identify factors important for influencing nucleosome occupancy and position, we compared our data to 40 existing whole-genome data sets. Factors associated with promoters, such as histone acetylation and H2A.z incorporation, were enriched at sites of nucleosome loss. Nucleosome retention was linked to stabilizing marks such as H3K36me2. Notably, the chromatin remodeler Isw2 was uniquely associated with retained occupancy and altered positioning, consistent with Isw2 stabilizing histone-DNA contacts and centering nucleosomes on available DNA in vivo. RNA-seq revealed a greater number of de-repressed genes (∼2,500) than previous studies, and these genes exhibited reduced nucleosome occupancy in their promoters. In summary, we identify factors likely to influence nucleosome stability under normal growth conditions and the specific genomic locations at which they act. We find that DNA-encoded nucleosome stability and chromatin composition dictate which nucleosomes will be lost under conditions of limiting histone protein and that this, in turn, governs which genes are susceptible to a loss of regulatory fidelity.
Conflict of interest statement
The authors have declared that no competing interests exist.
Figures


Similar articles
-
ISWI and CHD chromatin remodelers bind promoters but act in gene bodies.PLoS Genet. 2013;9(2):e1003317. doi: 10.1371/journal.pgen.1003317. Epub 2013 Feb 28. PLoS Genet. 2013. PMID: 23468649 Free PMC article.
-
A compendium of nucleosome and transcript profiles reveals determinants of chromatin architecture and transcription.PLoS Genet. 2013 May;9(5):e1003479. doi: 10.1371/journal.pgen.1003479. Epub 2013 May 2. PLoS Genet. 2013. PMID: 23658529 Free PMC article.
-
Chromatin remodeler Ino80C acts independently of H2A.Z to evict promoter nucleosomes and stimulate transcription of highly expressed genes in yeast.Nucleic Acids Res. 2020 Sep 4;48(15):8408-8430. doi: 10.1093/nar/gkaa571. Nucleic Acids Res. 2020. PMID: 32663283 Free PMC article.
-
The specificity of H2A.Z occupancy in the yeast genome and its relationship to transcription.Curr Genet. 2020 Oct;66(5):939-944. doi: 10.1007/s00294-020-01087-7. Epub 2020 Jun 14. Curr Genet. 2020. PMID: 32537667 Review.
-
Spanning the gap: unraveling RSC dynamics in vivo.Curr Genet. 2021 Jun;67(3):399-406. doi: 10.1007/s00294-020-01144-1. Epub 2021 Jan 23. Curr Genet. 2021. PMID: 33484328 Free PMC article. Review.
Cited by
-
CHD1 remodelers regulate nucleosome spacing in vitro and align nucleosomal arrays over gene coding regions in S. pombe.EMBO J. 2012 Nov 28;31(23):4388-403. doi: 10.1038/emboj.2012.289. Epub 2012 Oct 26. EMBO J. 2012. PMID: 23103765 Free PMC article.
-
Nucleosome organization in the vicinity of transcription factor binding sites in the human genome.BMC Genomics. 2014 Jun 19;15(1):493. doi: 10.1186/1471-2164-15-493. BMC Genomics. 2014. PMID: 24942981 Free PMC article.
-
Reduced histone gene copy number disrupts Drosophila Polycomb function.Genetics. 2023 Aug 9;224(4):iyad106. doi: 10.1093/genetics/iyad106. Genetics. 2023. PMID: 37279945 Free PMC article.
-
Dinucleosome specificity and allosteric switch of the ISW1a ATP-dependent chromatin remodeler in transcription regulation.Nat Commun. 2020 Nov 20;11(1):5913. doi: 10.1038/s41467-020-19700-1. Nat Commun. 2020. PMID: 33219211 Free PMC article.
-
Chromatin dynamics during DNA replication.Genome Res. 2016 Sep;26(9):1245-56. doi: 10.1101/gr.201244.115. Epub 2016 May 25. Genome Res. 2016. PMID: 27225843 Free PMC article.
References
-
- Han M, Grunstein M. Nucleosome loss activates yeast downstream promoters in vivo. Cell. 1988;55:1137–1145. - PubMed
-
- Wyrick JJ, Holstege FCP, Jennings EG, Causton HC, Shore D, et al. Chromosomal landscape of nucleosome-dependent gene expression and silencing in yeast. Nature. 1999;402:418–421. - PubMed
Publication types
MeSH terms
Substances
Grants and funding
LinkOut - more resources
Full Text Sources
Molecular Biology Databases

