

Hydroxychloroquine is associated with impaired interferon-alpha and tumor necrosis factor-alpha production by plasmacytoid dendritic cells in systemic lupus erythematosus
- PMID: 22734582
- PMCID: PMC3446541
- DOI: 10.1186/ar3895
Hydroxychloroquine is associated with impaired interferon-alpha and tumor necrosis factor-alpha production by plasmacytoid dendritic cells in systemic lupus erythematosus
Abstract
Introduction: Plasmacytoid dendritic cells (pDCs) constitutively express two members of the Toll-like receptor (TLR) family, TLR-9 and TLR-7, through which they can be stimulated to produce high levels of interferon (IFN)-α, a key mediator of the pathogenesis of systemic lupus erythematosus (SLE). Given the known efficacy of hydroxychloroquine (HCQ) in the treatment of SLE, we examined its ability to inhibit such pDC function in vivo.
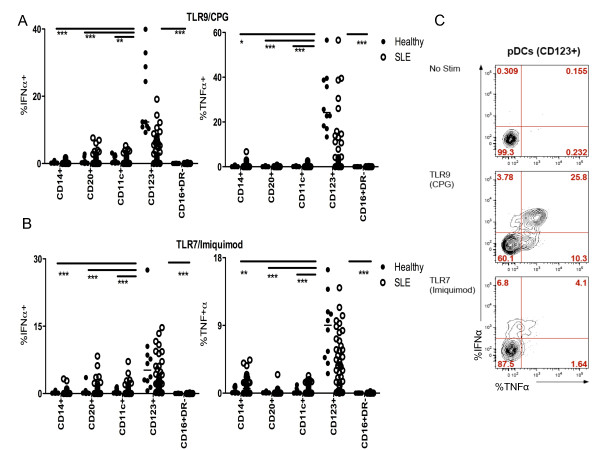
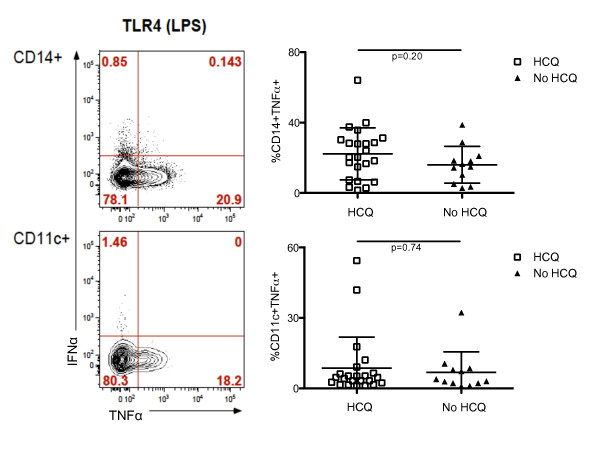
Methods: Peripheral blood mononuclear cells (PBMCs) from SLE subjects treated or not with HCQ and from healthy controls were stimulated with the TLR-9 agonist, CpG oligodeoxynucleotides (CpG-A ODN)-2216, and the TLR-7 agonist, imiquimod. The proportion of monocytes, B cells, myeloid dendritic cells, pDCs, and natural killer (NK) cells producing IFN-α and tumor necrosis factor alpha (TNF-α) was then analyzed by multiparameter flow cytometry.
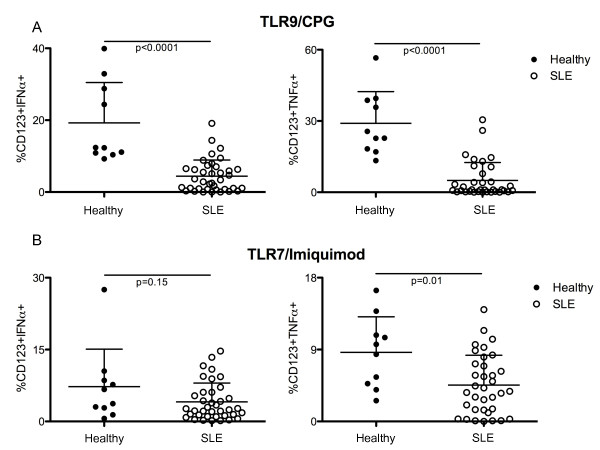
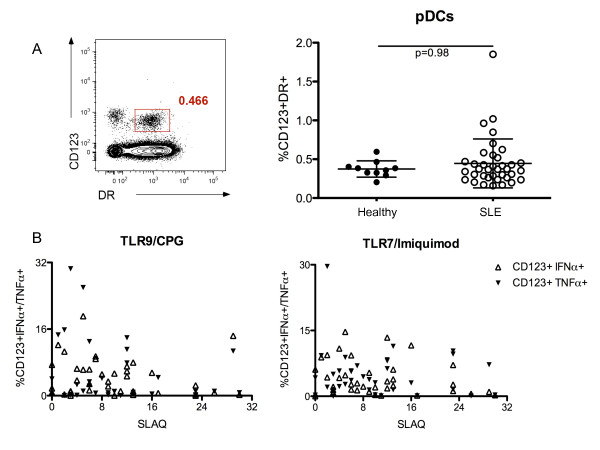
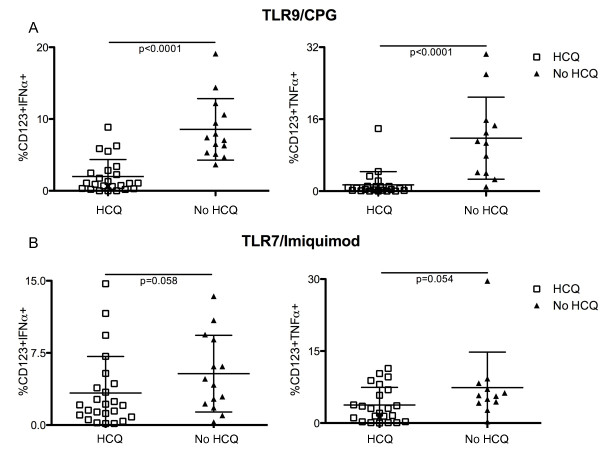
Results: After TLR-9/7 stimulation in both SLE and healthy subjects, significant production of IFN-α and TNF-α was only observed in pDCs. TLR-7 and TLR-9 induced IFN-α and TNF-α production by pDCs from subjects with SLE was decreased relative to that found in controls (TLR-9/IFN-α, P < 0.0001; TLR-9/TNF-α P < 0.0001; TLR-7/TNF-α P = 0.01). TLR-9 and TLR-7 induced IFN-α and TNF-α production by pDCs was severely impaired in 36% (TLR-9) and 33% (TLR-7) of SLE subjects. In almost all cases, these subjects were being treated with HCQ (HCQ vs. no HCQ: impaired TLR-9/IFN-α, P = 0.0003; impaired TLR-7/IFN-α, P = 0.07; impaired TLR-9/TNF-α, P < 0.009; impaired TLR-7/TNF-α, P < 0.01).
Conclusions: Treatment with HCQ is associated with impaired ability of pDCs from subjects with SLE to produce IFN-α and TNF-α upon stimulation with TLR-9 and TLR-7 agonists.
Figures
Similar articles
-
Dysfunctional interferon-alpha production by peripheral plasmacytoid dendritic cells upon Toll-like receptor-9 stimulation in patients with systemic lupus erythematosus.Arthritis Res Ther. 2008;10(2):R29. doi: 10.1186/ar2382. Epub 2008 Mar 6. Arthritis Res Ther. 2008. PMID: 18321389 Free PMC article.
-
Effect of in vivo Hydroxychloroquine and ex vivo Anti-BDCA2 mAb Treatment on pDC IFNα Production From Patients Affected With Cutaneous Lupus Erythematosus.Front Immunol. 2019 Feb 21;10:275. doi: 10.3389/fimmu.2019.00275. eCollection 2019. Front Immunol. 2019. PMID: 30846987 Free PMC article.
-
Cytokine production by activated plasmacytoid dendritic cells and natural killer cells is suppressed by an IRAK4 inhibitor.Arthritis Res Ther. 2018 Oct 24;20(1):238. doi: 10.1186/s13075-018-1702-0. Arthritis Res Ther. 2018. PMID: 30355354 Free PMC article.
-
Anti-interferon alpha treatment in SLE.Clin Immunol. 2013 Sep;148(3):303-12. doi: 10.1016/j.clim.2013.02.013. Epub 2013 Mar 1. Clin Immunol. 2013. PMID: 23566912 Review.
-
Hydroxychloroquine: a multifaceted treatment in lupus.Presse Med. 2014 Jun;43(6 Pt 2):e167-80. doi: 10.1016/j.lpm.2014.03.007. Epub 2014 May 19. Presse Med. 2014. PMID: 24855048 Review.
Cited by
-
Plasmacytoid DCs From Patients With Sjögren's Syndrome Are Transcriptionally Primed for Enhanced Pro-inflammatory Cytokine Production.Front Immunol. 2019 Sep 4;10:2096. doi: 10.3389/fimmu.2019.02096. eCollection 2019. Front Immunol. 2019. PMID: 31552042 Free PMC article.
-
Interferon score is increased in incomplete systemic lupus erythematosus and correlates with myxovirus-resistance protein A in blood and skin.Arthritis Res Ther. 2019 Dec 2;21(1):260. doi: 10.1186/s13075-019-2034-4. Arthritis Res Ther. 2019. PMID: 31791398 Free PMC article.
-
Interferon targeted therapies in systemic lupus erythematosus.Mediterr J Rheumatol. 2017 Mar 28;28(1):13-19. doi: 10.31138/mjr.28.1.13. eCollection 2017 Mar. Mediterr J Rheumatol. 2017. PMID: 32185249 Free PMC article. Review.
-
Biologics and Non-Biologics Immunosuppressive Treatments for IgA Nephropathy in Both Adults and Children.J Clin Med. 2024 Apr 23;13(9):2465. doi: 10.3390/jcm13092465. J Clin Med. 2024. PMID: 38730994 Free PMC article. Review.
-
Systemic lupus erythematosus: strategies to improve pregnancy outcomes.Int J Womens Health. 2016 Jul 8;8:265-72. doi: 10.2147/IJWH.S90157. eCollection 2016. Int J Womens Health. 2016. PMID: 27468250 Free PMC article. Review.
References
-
- Remmers EF, Plenge RM, Lee AT, Graham RR, Hom G, Behrens TW, de Bakker PI, Le JM, Lee HS, Batliwalla F, Li W, Masters SL, Booty MG, Carulli JP, Padyukov L, Alfredsson L, Klareskog L, Chen WV, Amos CI, Criswell LA, Seldin MF, Kastner DL, Gregersen PK. STAT4 and the risk of rheumatoid arthritis and systemic lupus erythematosus. N Engl J Med. 2007;357:977–986. doi: 10.1056/NEJMoa073003. - DOI - PMC - PubMed
-
- Sigurdsson S, Nordmark G, Goring HH, Lindroos K, Wiman AC, Sturfelt G, Jonsen A, Rantapaa-Dahlqvist S, Moller B, Kere J, Koskenmies S, Widén E, Eloranta ML, Julkunen H, Kristjansdottir H, Steinsson K, Alm G, Rönnblom L, Syvänen AC. Polymorphisms in the tyrosine kinase 2 and interferon regulatory factor 5 genes are associated with systemic lupus erythematosus. Am J Hum Genet. 2005;76:528–537. doi: 10.1086/428480. - DOI - PMC - PubMed
Publication types
MeSH terms
Substances
Grants and funding
LinkOut - more resources
Full Text Sources
Other Literature Sources
Medical
