

Distinct regulation of cytoplasmic calcium signals and cell death pathways by different plasma membrane calcium ATPase isoforms in MDA-MB-231 breast cancer cells
- PMID: 22733819
- PMCID: PMC3436507
- DOI: 10.1074/jbc.M112.364737
Distinct regulation of cytoplasmic calcium signals and cell death pathways by different plasma membrane calcium ATPase isoforms in MDA-MB-231 breast cancer cells
Abstract
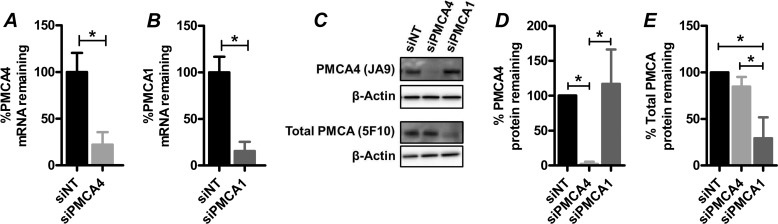
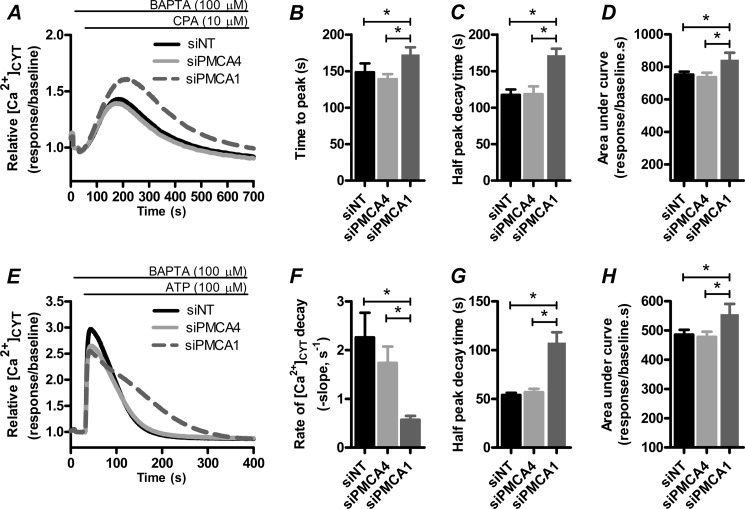
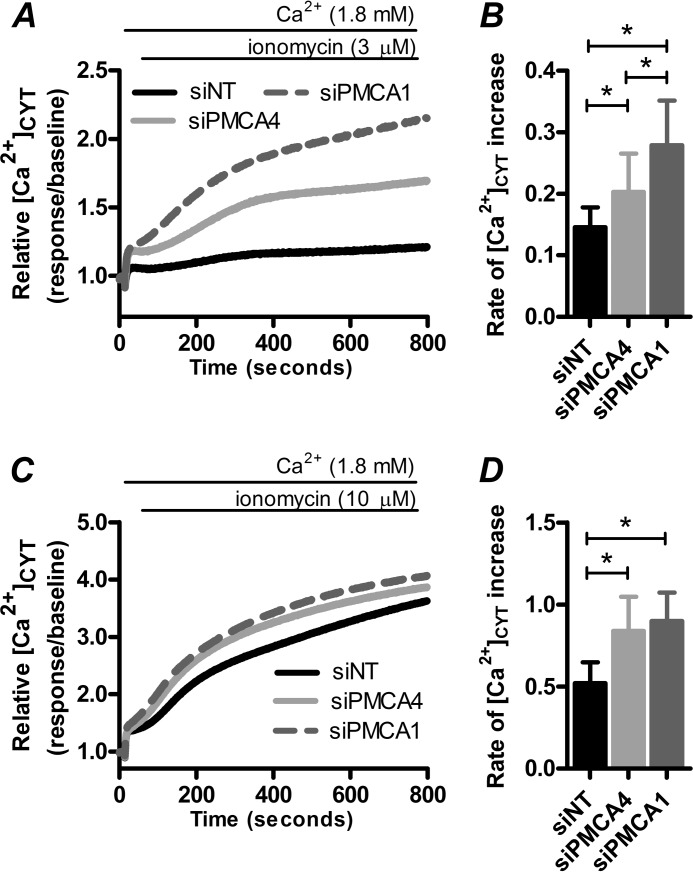
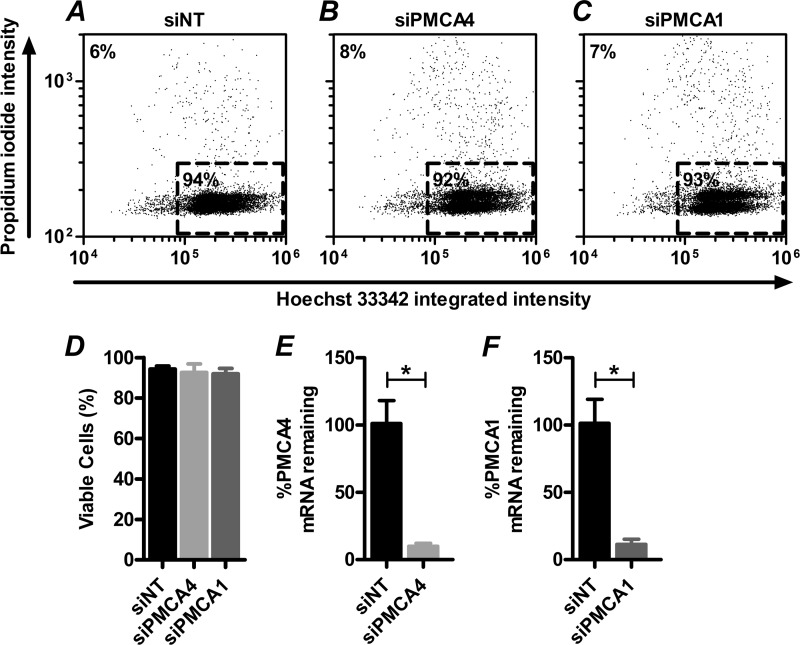
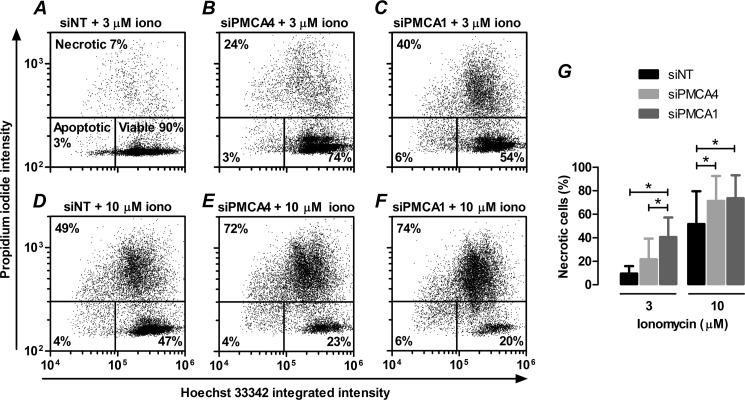
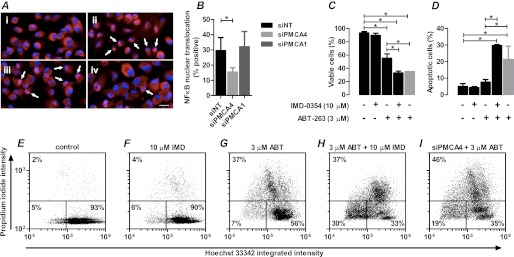
Plasma membrane calcium ATPases (PMCAs) actively extrude Ca(2+) from the cell and are essential components in maintaining intracellular Ca(2+) homeostasis. There are four PMCA isoforms (PMCA1-4), and alternative splicing of the PMCA genes creates a suite of calcium efflux pumps. The role of these different PMCA isoforms in the control of calcium-regulated cell death pathways and the significance of the expression of multiple isoforms of PMCA in the same cell type are not well understood. In these studies, we assessed the impact of PMCA1 and PMCA4 silencing on cytoplasmic free Ca(2+) signals and cell viability in MDA-MB-231 breast cancer cells. The PMCA1 isoform was the predominant regulator of global Ca(2+) signals in MDA-MB-231 cells. PMCA4 played only a minor role in the regulation of bulk cytosolic Ca(2+), which was more evident at higher Ca(2+) loads. Although PMCA1 or PMCA4 knockdown alone had no effect on MDA-MB-231 cell viability, silencing of these isoforms had distinct consequences on caspase-independent (ionomycin) and -dependent (ABT-263) cell death. PMCA1 knockdown augmented necrosis mediated by the Ca(2+) ionophore ionomycin, whereas apoptosis mediated by the Bcl-2 inhibitor ABT-263 was enhanced by PMCA4 silencing. PMCA4 silencing was also associated with an inhibition of NFκB nuclear translocation, and an NFκB inhibitor phenocopied the effects of PMCA4 silencing in promoting ABT-263-induced cell death. This study demonstrates distinct roles for PMCA1 and PMCA4 in the regulation of calcium signaling and cell death pathways despite the widespread distribution of these two isoforms. The targeting of some PMCA isoforms may enhance the effectiveness of therapies that act through the promotion of cell death pathways in cancer cells.
Figures


Similar articles
-
PMCA2 silencing potentiates MDA-MB-231 breast cancer cell death initiated with the Bcl-2 inhibitor ABT-263.Biochem Biophys Res Commun. 2016 Sep 30;478(4):1792-7. doi: 10.1016/j.bbrc.2016.09.030. Epub 2016 Sep 7. Biochem Biophys Res Commun. 2016. PMID: 27613092
-
Distinct roles of PMCA isoforms in Ca2+ homeostasis of bladder smooth muscle: evidence from PMCA gene-ablated mice.Am J Physiol Cell Physiol. 2007 Jan;292(1):C423-31. doi: 10.1152/ajpcell.00313.2006. Epub 2006 Sep 6. Am J Physiol Cell Physiol. 2007. PMID: 16956963
-
Plasma membrane Ca2+ ATPase 1 (PMCA1) but not PMCA4 is critical for B-cell development and Ca2+ homeostasis in mice.Eur J Immunol. 2021 Mar;51(3):594-602. doi: 10.1002/eji.202048654. Epub 2020 Nov 16. Eur J Immunol. 2021. PMID: 33098669
-
Plasma membrane Ca(2+)-ATPase: from a housekeeping function to a versatile signaling role.Pflugers Arch. 2009 Jan;457(3):657-64. doi: 10.1007/s00424-008-0505-6. Epub 2008 Jun 12. Pflugers Arch. 2009. PMID: 18548270 Review.
-
Role of alternative splicing in generating isoform diversity among plasma membrane calcium pumps.Physiol Rev. 2001 Jan;81(1):21-50. doi: 10.1152/physrev.2001.81.1.21. Physiol Rev. 2001. PMID: 11152753 Review.
Cited by
-
The Effects of 4'-Esterified Resveratrol Derivatives on Calcium Dynamics in Breast Cancer Cells.Molecules. 2017 Nov 14;22(11):1968. doi: 10.3390/molecules22111968. Molecules. 2017. PMID: 29135943 Free PMC article.
-
The plasma membrane calcium ATPase 4 signalling in cardiac fibroblasts mediates cardiomyocyte hypertrophy.Nat Commun. 2016 Mar 29;7:11074. doi: 10.1038/ncomms11074. Nat Commun. 2016. PMID: 27020607 Free PMC article.
-
Multiple Calcium Export Exchangers and Pumps Are a Prominent Feature of Enamel Organ Cells.Front Physiol. 2017 May 23;8:336. doi: 10.3389/fphys.2017.00336. eCollection 2017. Front Physiol. 2017. PMID: 28588505 Free PMC article.
-
Calcium Signalling in Breast Cancer Associated Bone Pain.Int J Mol Sci. 2022 Feb 8;23(3):1902. doi: 10.3390/ijms23031902. Int J Mol Sci. 2022. PMID: 35163823 Free PMC article. Review.
-
The effect of iron on the expression levels of calcium related gene in cisplatin resistant epithelial ovarian cancer cells.Explor Target Antitumor Ther. 2021;2(4):309-322. doi: 10.37349/etat.2021.00048. Epub 2021 Aug 30. Explor Target Antitumor Ther. 2021. PMID: 36046755 Free PMC article.
References
-
- Di Leva F., Domi T., Fedrizzi L., Lim D., Carafoli E. (2008) The plasma membrane Ca2+ ATPase of animal cells: Structure, function, and regulation. Arch. Biochem. Biophys. 476, 65–74 - PubMed
-
- Brini M., Coletto L., Pierobon N., Kraev N., Guerini D., Carafoli E. (2003) A comparative functional analysis of plasma membrane Ca2+ pump isoforms in intact cells. J. Biol. Chem. 278, 24500–24508 - PubMed
-
- Berridge M. J., Lipp P., Bootman M. D. (2000) The versatility and universality of calcium signaling. Nat. Rev. Mol. Cell Biol. 1, 11–21 - PubMed
-
- Strehler E. E., Zacharias D. A. (2001) Role of alternative splicing in generating isoform diversity among plasma membrane calcium pumps. Physiol. Rev. 81, 21–50 - PubMed
-
- Prasad V., Okunade G. W., Miller M. L., Shull G. E. (2004) Phenotypes of SERCA and PMCA knock-out mice. Biochem. Biophys. Res. Commun. 322, 1192–1203 - PubMed
Publication types
MeSH terms
Substances
LinkOut - more resources
Full Text Sources
Medical
Miscellaneous
