. 2012 Sep 1;40(17):8296-308.
doi: 10.1093/nar/gks574. Epub 2012 Jun 22.

Cooperative cluster formation, DNA bending and base-flipping by O6-alkylguanine-DNA alkyltransferase

Affiliations

Cooperative cluster formation, DNA bending and base-flipping by O6-alkylguanine-DNA alkyltransferase

Ingrid Tessmer et al. Nucleic Acids Res. .

Abstract

O6-Alkylguanine-DNA alkyltransferase (AGT) repairs mutagenic O6-alkylguanine and O4-alkylthymine adducts in DNA, protecting the genome and also contributing to the resistance of tumors to chemotherapeutic alkylating agents. AGT binds DNA cooperatively, and cooperative interactions are likely to be important in lesion search and repair. We examined morphologies of complexes on long, unmodified DNAs, using analytical ultracentrifugation and atomic force microscopy. AGT formed clusters of ≤11 proteins. Longer clusters, predicted by the McGhee-von Hippel model, were not seen even at high [protein]. Interestingly, torsional stress due to DNA unwinding has the potential to limit cluster size to the observed range. DNA at cluster sites showed bend angles (∼0, ∼30 and ∼60°) that are consistent with models in which each protein induces a bend of ∼30°. Distributions of complexes along the DNA are incompatible with sequence specificity but suggest modest preference for DNA ends. These properties tell us about environments in which AGT may function. Small cooperative clusters and the ability to accommodate a range of DNA bends allow function where DNA topology is constrained, such as near DNA-replication complexes. The low sequence specificity allows efficient and unbiased lesion search across the entire genome.


Figures
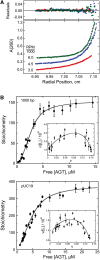
Figure 1.
Figure 1.
Analysis of AGT–DNA interactions by analytical ultracentrifugation. (A) Sedimentation equilibrium data for an AGT–DNA mixture obtained at 20 ± 0.1°C. This sample contained the 1000-bp DNA fragment (0.015 µM) and AGT protein (3.5 µM) in 10 mM Tris (pH 7.6 at 20°C), 1 mM EDTA, 100 mM NaCl and 1 mM DTT. Radial scans taken at 3000 rpm (red), 4500 rpm (blue) and 6000 rpm (green) are shown with vertical offsets for clarity. The smooth curves correspond to fits of equation 1 to these data. Small, symmetrically distributed residuals (upper panel) indicate that the two-species model represented by equation 1 is consistent with the mass distributions of DNA in these samples. (B) Dependence of binding stoichiometry on free AGT concentration for the 1000-bp fragment (upper panel) and linear pUC19 DNA (lower panel). Stoichiometries were inferred from weight-average molecular weights measured at sedimentation equilibrium. Error bars are 95% confidence limits for the individual parameters. The smooth curve is an isotherm calculated with equation 4 using parameters determined from the Scatchard plots shown in the insets. Insets: Scatchard plots for the data ensembles shown in the main panels. The solid curves are fits of equation 4, returning K = 9667 ± 1499, ω = 35.9 ± 6.8 and s = 6.32 ± 0.12 for binding the 1000-bp fragment and K = 7960 ± 916, ω = 44.2 ± 3.8 and s = 6.81 ± 0.14 for binding linear pUC19 DNA.
Figure 2.
Figure 2.
Predicted dependence of the mean cluster size formula image on AGT concentration. Values of formula image were calculated with equation 5 using measured values of ν as functions of [AGT] and values of ω and s from the Scatchard analyses shown in Figure 1. The confidence intervals (bars) were calculated by propagating 95% confidence limits for measured ω and s parameters through equation 5.
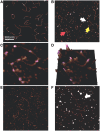
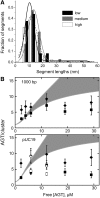
Figure 3.
Figure 3.
Visualization of AGT cooperative units on DNA. AFM images of the 1000-bp DNA fragment in the absence of protein (A) and after incubation with AGT at 6 μM at a protein:DNA ratio of 100:1 (B) or 12 μM AGT and protein:DNA ratio of 200:1 (C) show increasing numbers of AGT clusters on the DNA with increasing protein concentration. A three-dimensional projection of the data from (C) is shown in (D). Results are not dependent on the DNA substrate used: the image in (E) shows similar results for a linearized pUC19 plasmid substrate after incubation with 12 μM AGT. To test whether protein distributions were affected by the deposition process, samples containing linear pUC19 (60 nM) and AGT (12 µM) were crosslinked with glutaraldehyde (0.1% glutaraldehyde, 10 min at 37°C) and then applied to the mica substrate (F). Sodium dodecyl sulfate–polyacrylamide gel electrophoresis analysis (Supplementary Figure S4) showed that >50% of AGT molecules were crosslinked to a neighbor by this treatment. Arrows in (B) indicate AGT clusters on the DNA fragments. Images are 1 μm × 1 μm (A, B, E, F) and 170 nm × 170 nm (C, D).
Figure 4.
Figure 4.
Comparison of measured and theoretical cluster length distributions. (A) Distribution of AGT cluster lengths on 1000-bp DNA fragments for incubations at 2 μM (black, n = 125), 6 μM (gray, n = 36) and 12 μM (white, n = 178) AGT. For comparison, data are shown as fractions of the total number of complexes for each protein concentration. Gaussian fits to the distributions give comparable cluster lengths of 10, 13 and 11 nm for 2 μM (black line), 6 μM (gray line) and 12 μM AGT (dashed line), respectively (all fits were characterized by R2 ≥ 0.97). (B) Comparison of measured cluster sizes, expressed as protein molecules/cluster (symbols), with cluster size predictions from the McGhee–von Hippel model (gray zones). Two values are given for each set of measurements; rtip-corrected values (filled square) as lower limit estimates of the number of AGT monomers per cluster and uncorrected values (filled diamond) as upper limit estimates. Open symbols (open square, open diamond) denote measurements made after glutaraldehyde crosslinking. Error bars give the standard deviations of each sample population. Ranges for formula image predicted for the McGhee–von Hippel binding model (gray zones) were calculated with equation 5, using experimental values of n, ω and s and corresponding error ranges as determined in Figure 1B.
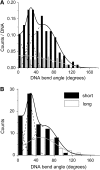
Figure 5.
Figure 5.
DNA bending associated with AGT clusters. (A) DNA bend-angle distributions were measured in the absence (gray, n = 75) or presence of AGT (black, n = 139). The dashed lines show the result of a Gaussian decomposition for AGT-induced bending that gives three peaks, centered around 0 ± 13°, 27 ± 9° and 58 ± 29° (R2 > 0.97). In the absence of AGT, bend angles measured at salt contaminant peaks on the DNA show a broad distribution centered at 0°. In comparison, DNA bend angles measured at random positions along the DNA backbone in the absence of protein also display mean bending of 0° but with narrower distribution width (Supplementary Figure S5). (B) DNA bend-angle distributions separated for different cluster lengths: short complexes (≤5 proteins, black bars) and long complexes (>6 proteins; white bars). Gaussian fits to the short cluster population suggest mean bend angles of 0 ± 10°, 26 ± 13° and 60 ± 27° (black line with dashed lines showing the three Gaussian components; R2 > 0.99, n = 81) and for the longer complexes a broad distribution centered at a mean bend angle of (50 ± 35) ° (light gray line; R2 > 0.97, n = 33).
Figure 6.
Figure 6.
Distribution of AGT clusters along the DNA contour. Fractional occupancies for 50-bp-long sections of the 1000-bp DNA fragment, demonstrating increasing protein coverage of the DNA for increasing AGT concentrations as well as preferential DNA end binding. Because the unmodified DNA ends used in these experiments could not be distinguished, locations are reported in units of fractional DNA length ranging from 0% (at a DNA end) to 50% (at the DNA center). Low and high [AGT] correspond to incubations at 2 μM AGT (gray, 2.6 ± 0.3 peaks per DNA, n = 220) and 12 μM AGT (white, 4.6 ± 2.2 peaks per DNA, n = 159), respectively. Error bars represent the deviations of two independent experiments. For comparison, DNA in the absence of protein is shown (black, 0.7 peaks per DNA, n = 54 from one experiment). Peaks on the DNA in the absence of AGT likely stem from salt contaminations but were treated like AGT segments in the analyses because they are difficult to distinguish from protein peaks and are likely also present in samples after incubation with AGT.
Figure 7.
Figure 7.
Base-flipping detected by 2AP fluorescence. (A) Steady-state emission spectra for a ssDNA containing a 5′-terminal 2AP residue and mixtures of this DNA with AGT. Solutions contained oligo 3 DNA (5.6 µM) and 0–44.9 µM AGT in 10 mM Tris, (pH 7.6 at 20°C), 1 mM EDTA, 100 mM NaCl and 1 mM DTT. Measurements were made at 20°C with excitation at 325 nm. Spectra, in order of lowest curve to highest, are for solutions containing AGT at final concentrations of 0, 2.8, 5.6, 8.4, 11.2, 14, 16.8, 19.7, 22.5, 28.1, 33.7, 39.3 and 44.9 µM, respectively. (B) Normalized emission intensities as functions of [AGT]/[DNA] ratio, for solutions containing single-stranded or duplex DNAs labeled with a 5′-terminal 2AP residue. DNAs were oligo 3 (5.6 µM) or the duplex containing oligos 3 and 5 (5.3 µM). Buffer and spectroscopy conditions were as described for Panel A. Labels ss and ds denote ssDNAs and dsDNAs, respectively. (C) Normalized emission intensities as functions of [AGT]/[DNA] ratio, for solutions containing single-stranded or duplex DNAs labeled at an internal position with a 2AP residue. DNAs were oligo 4 (5.2 µM) or the duplex containing oligos 4 and 5 (5.4 µM). Buffer and spectroscopy conditions were as described for Panel A. (D) Verification of binding by circular dichroism. Samples containing duplex DNA (aliquots of solutions used in the fluorescence experiments shown in Panels B and C) were subjected to CD spectroscopy. Molar ellipticity values (per nucleotide) at 260 nm are graphed as functions of [AGT]/[DNA] ratios for double-stranded 16-mers labeled with 2AP either internally or at the 5′-end. The lines are linear fits to subsets of the data. Break points at [AGT]/DNA] ∼4 agree with previous stoichiometry measures for binding duplex 16-mer DNAs (16,17).
Figure 8.
Figure 8.
Comparison of predicted torsional free energies (ΔG(twist)) and cooperative free energies (ΔG(cooperative)) for clusters of 4–12 AGT proteins. ΔG is given as its absolute value. The quadratic model (equation 6) was used to calculate the cumulative ΔG(twist) as functions of proteins/cluster (N) for displacements of 6–10°/protein. The red and blue lines give |ΔG(cooperative)| for the addition of a single protein molecule to complexes formed on linear pUC19 DNA and the 1000-bp fragment, respectively. The intersections of these functions indicate where ΔG(twist) = −ΔG(cooperative). A vertical gray line is plotted for a cluster length of 6.7 proteins, the mean of all length estimates for [AGT] ≥ 6 µM, for the 1000-bp DNA. The lighter gray zone spans between means of minimum and maximum estimates of cluster length.
Figure 9.
Figure 9.
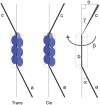
Paired DNA bends produce a triphasic angle distribution. In our model of the cooperative complex, each AGT monomer occupies 4 bp, adding 1.36 nm to the cluster length. Each protein is rotated ∼ 138° with respect to its nearest neighbors; modest DNA bends associated with each protein cause the DNA to follow a gentle writhe about a central axis (51). In this diagram, the blue ovals represent AGT proteins, line segments a and c represent the axes of the free DNA entering and leaving the complex and segment b represents the writhe axis of DNA within the complex. Angles α and γ are the angles formed when the DNA enters and departs from this writhe, while angle β is the dihedral angle, which depends on the number of proteins in the complex. Complexes with dihedral angles near 0° will be captured on the planar AFM substrate in a cis arrangement, complexes with dihedral angles near 180° will be captured in a trans conformation and complexes in which 0° < β < 180° are seen in projection. For each complex, the bend angle apparent to AFM is that of a segment with respect to segment c and is thus the sum of angles α and γ or their projections, on the plane of the AFM matrix.

Similar articles

Cited by

References

    1. Fang Q, Kanugula S, Tubbs JL, Tainer JA, Pegg AE. Repair of O4-alkylthymine by O6-alkylguanine-DNA alkyltransferases. J. Biol. Chem. 2010;285:8185–8195. - PMC - PubMed
    1. Shrivastav N, Li D, Essigmann JM. Chemical biology of mutagenesis and DNA repair: cellular responses to DNA alkylation. Carcinogenesis. 2010;31:59–70. - PMC - PubMed
    1. Tubbs JL, Pegg AE, Tainer JA. DNA binding, nucleotide flipping, and the helix-turn-helix motif in base repair by O6-alkylguanine-DNA alkyltransferase and its implications for cancer chemotherapy. DNA Repair. 2007;6:1100–1115. - PMC - PubMed
    1. Pegg AE. Multifaceted roles of alkyltransferase and related proteins in DNA repair, DNA damage, resistance to chemotherapy and research tools. Chem. Res. Toxicol. 2011;24:618–639. - PMC - PubMed
    1. Pegg AE. Mammalian O6-alkylguanine-DNA alkyltransferase: regulation and importance in response to alkylating carcinogens and therapeutic agents. Cancer Res. 1990;50:6119–6129. - PubMed

Publication types

MeSH terms

Substances