Loss of wnt/β-catenin signaling causes cell fate shift of preosteoblasts from osteoblasts to adipocytes
- PMID: 22729939
- PMCID: PMC3474875
- DOI: 10.1002/jbmr.1694
Loss of wnt/β-catenin signaling causes cell fate shift of preosteoblasts from osteoblasts to adipocytes
Abstract
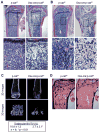
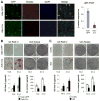
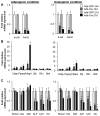
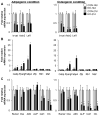
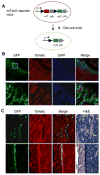
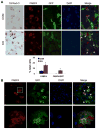
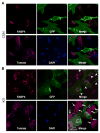
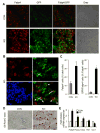
Wnt signaling is essential for osteogenesis and also functions as an adipogenic switch, but it is not known if interrupting wnt signaling via knockout of β-catenin from osteoblasts would cause bone marrow adiposity. Here, we determined whether postnatal deletion of β-catenin in preosteoblasts, through conditional cre expression driven by the osterix promoter, causes bone marrow adiposity. Postnatal disruption of β-catenin in the preosteoblasts led to extensive bone marrow adiposity and low bone mass in adult mice. In cultured bone marrow-derived cells isolated from the knockout mice, adipogenic differentiation was dramatically increased, whereas osteogenic differentiation was significantly decreased. As myoblasts, in the absence of wnt/β-catenin signaling, can be reprogrammed into the adipocyte lineage, we sought to determine whether the increased adipogenesis we observed partly resulted from a cell-fate shift of preosteoblasts that had to express osterix (lineage-committed early osteoblasts), from the osteoblastic to the adipocyte lineage. Using lineage tracing both in vivo and in vitro we showed that the loss of β-catenin from preosteoblasts caused a cell-fate shift of these cells from osteoblasts to adipocytes, a shift that may at least partly contribute to the bone marrow adiposity and low bone mass in the knockout mice. These novel findings indicate that wnt/β-catenin signaling exerts control over the fate of lineage-committed early osteoblasts, with respect to their differentiation into osteoblastic versus adipocytic populations in bone, and thus offers potential insight into the origin of bone marrow adiposity.
Copyright © 2012 American Society for Bone and Mineral Research.
Conflict of interest statement
All authors state that they have no conflicts of interest.
Figures
Similar articles
-
FAK Promotes Osteoblast Progenitor Cell Proliferation and Differentiation by Enhancing Wnt Signaling.J Bone Miner Res. 2016 Dec;31(12):2227-2238. doi: 10.1002/jbmr.2908. Epub 2016 Oct 24. J Bone Miner Res. 2016. PMID: 27391080 Free PMC article.
-
Postnatal deletion of β-catenin in osterix-expressing cells is necessary for bone growth and intermittent PTH-induced bone gain.J Bone Miner Metab. 2018 Sep;36(5):560-572. doi: 10.1007/s00774-017-0873-0. Epub 2017 Nov 9. J Bone Miner Metab. 2018. PMID: 29124436
-
Tsc1 Regulates the Balance Between Osteoblast and Adipocyte Differentiation Through Autophagy/Notch1/β-Catenin Cascade.J Bone Miner Res. 2018 Nov;33(11):2021-2034. doi: 10.1002/jbmr.3530. Epub 2018 Jul 19. J Bone Miner Res. 2018. PMID: 29924882 Free PMC article.
-
PPARγ and Wnt Signaling in Adipogenic and Osteogenic Differentiation of Mesenchymal Stem Cells.Curr Stem Cell Res Ther. 2016;11(3):216-25. doi: 10.2174/1574888x10666150519093429. Curr Stem Cell Res Ther. 2016. PMID: 25986621 Review.
-
New factors controlling the balance between osteoblastogenesis and adipogenesis.Bone. 2012 Feb;50(2):540-5. doi: 10.1016/j.bone.2011.06.030. Epub 2011 Jul 1. Bone. 2012. PMID: 21745614 Review.
Cited by
-
Functional interaction between Wnt and Bmp signaling in periosteal bone growth.Sci Rep. 2021 May 24;11(1):10782. doi: 10.1038/s41598-021-90324-1. Sci Rep. 2021. PMID: 34031510 Free PMC article.
-
Sclerostin antibody treatment improves fracture outcomes in a Type I diabetic mouse model.Bone. 2016 Jan;82:122-34. doi: 10.1016/j.bone.2015.04.048. Epub 2015 May 5. Bone. 2016. PMID: 25952969 Free PMC article.
-
Similarities Between Disuse and Age-Induced Bone Loss.J Bone Miner Res. 2022 Aug;37(8):1417-1434. doi: 10.1002/jbmr.4643. Epub 2022 Jul 28. J Bone Miner Res. 2022. PMID: 35773785 Free PMC article. Review.
-
Loss of Gsα early in the osteoblast lineage favors adipogenic differentiation of mesenchymal progenitors and committed osteoblast precursors.J Bone Miner Res. 2014 Nov;29(11):2414-26. doi: 10.1002/jbmr.2270. J Bone Miner Res. 2014. PMID: 24806274 Free PMC article.
-
Rictor is required for optimal bone accrual in response to anti-sclerostin therapy in the mouse.Bone. 2016 Apr;85:1-8. doi: 10.1016/j.bone.2016.01.013. Epub 2016 Jan 15. Bone. 2016. PMID: 26780446 Free PMC article.
References
-
- Nuttall ME, Gimble JM. Is there a therapeutic opportunity to either prevent or treat osteopenic disorders by inhibiting marrow adipogenesis? Bone. 2000;27(2):177–84. - PubMed
-
- Minaire P, Neunier P, Edouard C, Bernard J, Courpron P, Bourret J. Quantitative histological data on disuse osteoporosis: comparison with biological data. Calcif Tissue Res. 1974;17(1):57–73. - PubMed
-
- Ahdjoudj S, Lasmoles F, Holy X, Zerath E, Marie PJ. Transforming growth factor beta2 inhibits adipocyte differentiation induced by skeletal unloading in rat bone marrow stroma. J Bone Miner Res. 2002;17(4):668–77. - PubMed
-
- Wronski TJ, Morey-Holton E, Jee WS. Skeletal alterations in rats during space flight. Adv Space Res. 1981;1(14):135–40. - PubMed
-
- Meunier P, Aaron J, Edouard C, Vignon G. Osteoporosis and the replacement of cell populations of the marrow by adipose tissue. A quantitative study of 84 iliac bone biopsies. Clin Orthop Relat Res. 1971;80:147–54. - PubMed
Publication types
MeSH terms
Substances
Grants and funding
LinkOut - more resources
Full Text Sources
Other Literature Sources
Molecular Biology Databases
Research Materials

