

Fast-degrading elastomer enables rapid remodeling of a cell-free synthetic graft into a neoartery
- PMID: 22729285
- PMCID: PMC3438366
- DOI: 10.1038/nm.2821
Fast-degrading elastomer enables rapid remodeling of a cell-free synthetic graft into a neoartery
Abstract
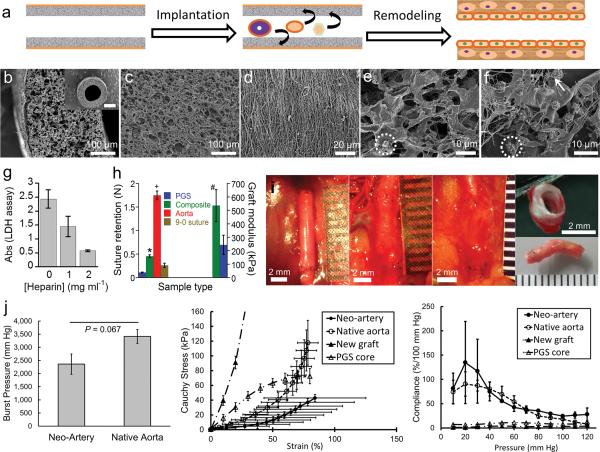
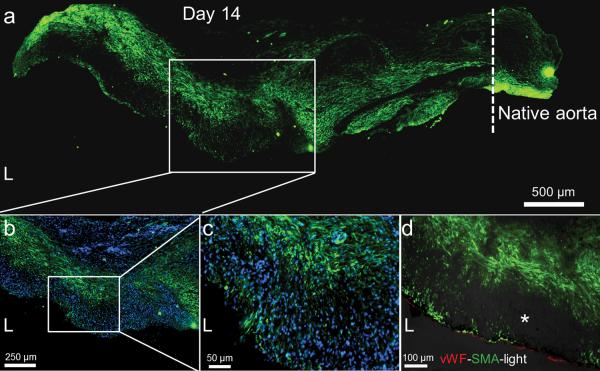
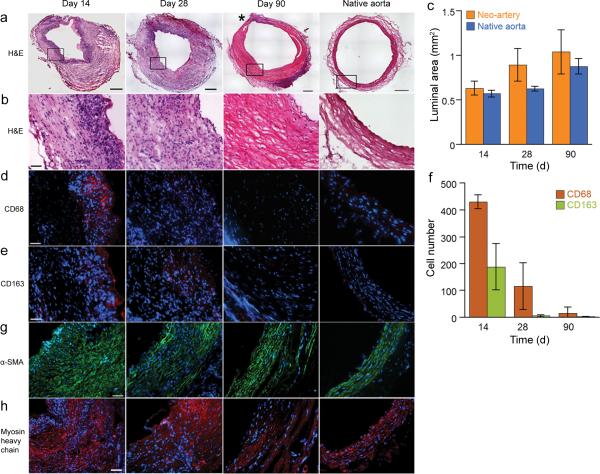
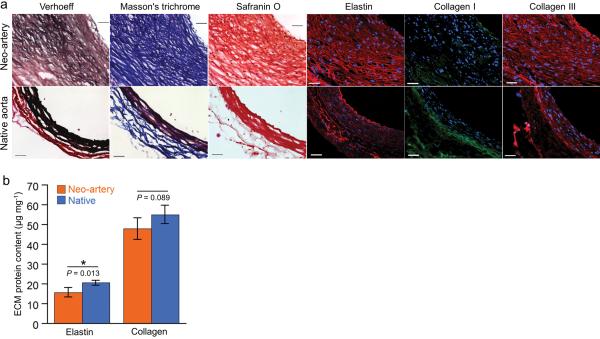
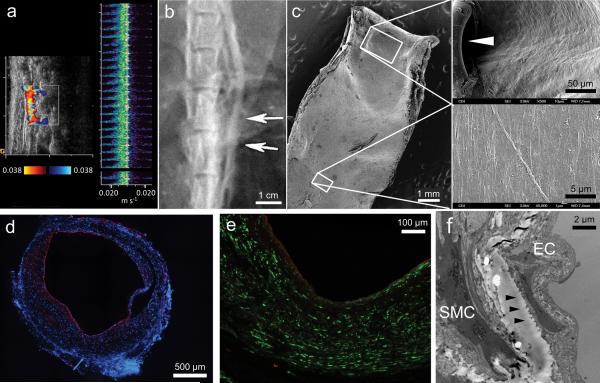
Host remodeling is important for the success of medical implants, including vascular substitutes. Synthetic and tissue-engineered grafts have yet to show clinical effectiveness in arteries smaller than 5 mm in diameter. We designed cell-free biodegradable elastomeric grafts that degrade rapidly to yield neoarteries nearly free of foreign materials 3 months after interposition grafting in rat abdominal aorta. This design focuses on enabling rapid host remodeling. Three months after implantation, the neoarteries resembled native arteries in the following aspects: regular, strong and synchronous pulsation; a confluent endothelium and contractile smooth muscle layers; expression of elastin, collagen and glycosaminoglycan; and tough and compliant mechanical properties. Therefore, future studies employing large animal models more representative of human vascular regeneration are warranted before clinical translation. This cell-free approach represents a philosophical shift from the prevailing focus on cells in vascular tissue engineering and may have an impact on regenerative medicine in general.
Figures
Similar articles
-
Fast degrading elastomer stented fascia remodels into tough and vascularized construct for tracheal regeneration.Mater Sci Eng C Mater Biol Appl. 2019 Aug;101:1-14. doi: 10.1016/j.msec.2019.02.108. Epub 2019 Mar 21. Mater Sci Eng C Mater Biol Appl. 2019. PMID: 31029302
-
Physiologic compliance in engineered small-diameter arterial constructs based on an elastomeric substrate.Biomaterials. 2010 Mar;31(7):1626-35. doi: 10.1016/j.biomaterials.2009.11.035. Epub 2009 Dec 3. Biomaterials. 2010. PMID: 19962188 Free PMC article.
-
Appropriate density of PCL nano-fiber sheath promoted muscular remodeling of PGS/PCL grafts in arterial circulation.Biomaterials. 2016 May;88:34-47. doi: 10.1016/j.biomaterials.2016.02.026. Epub 2016 Feb 23. Biomaterials. 2016. PMID: 26943048
-
Polyglycerol sebacate-based elastomeric materials for arterial regeneration.J Biomed Mater Res A. 2024 Apr;112(4):574-585. doi: 10.1002/jbm.a.37583. Epub 2023 Jun 22. J Biomed Mater Res A. 2024. PMID: 37345954 Review.
-
Achieving the ideal properties for vascular bypass grafts using a tissue engineered approach: a review.Med Biol Eng Comput. 2007 Apr;45(4):327-36. doi: 10.1007/s11517-007-0176-z. Epub 2007 Mar 6. Med Biol Eng Comput. 2007. PMID: 17340153 Review.
Cited by
-
Arterial grafts exhibiting unprecedented cellular infiltration and remodeling in vivo: the role of cells in the vascular wall.Biomaterials. 2015 May;50:115-26. doi: 10.1016/j.biomaterials.2015.01.045. Epub 2015 Feb 17. Biomaterials. 2015. PMID: 25736502 Free PMC article.
-
Novel reinforcement of corrugated nanofiber tissue-engineered vascular graft to prevent aneurysm formation for arteriovenous shunts in an ovine model.JVS Vasc Sci. 2022 Feb 22;3:182-191. doi: 10.1016/j.jvssci.2022.01.002. eCollection 2022. JVS Vasc Sci. 2022. PMID: 35495567 Free PMC article.
-
In Vitro Evaluation of Essential Mechanical Properties and Cell Behaviors of a Novel Polylactic-co-Glycolic Acid (PLGA)-Based Tubular Scaffold for Small-Diameter Vascular Tissue Engineering.Polymers (Basel). 2017 Jul 30;9(8):318. doi: 10.3390/polym9080318. Polymers (Basel). 2017. PMID: 30970995 Free PMC article.
-
In Situ Blood Vessel Regeneration Using SP (Substance P) and SDF (Stromal Cell-Derived Factor)-1α Peptide Eluting Vascular Grafts.Arterioscler Thromb Vasc Biol. 2018 Jul;38(7):e117-e134. doi: 10.1161/ATVBAHA.118.310934. Epub 2018 May 31. Arterioscler Thromb Vasc Biol. 2018. PMID: 29853570 Free PMC article.
-
A novel in vitro model for microvasculature reveals regulation of circumferential ECM organization by curvature.PLoS One. 2013 Nov 21;8(11):e81061. doi: 10.1371/journal.pone.0081061. eCollection 2013. PLoS One. 2013. PMID: 24278378 Free PMC article.
References
-
- Weinberg CB, Bell E. A blood vessel model constructed from collagen and cultured vascular cells. Science. 1986;231:397–400. - PubMed
-
- Niklason LE, et al. Functional arteries grown in vitro. Science. 1999;284:489–493. - PubMed
-
- Dahl SL, et al. Readily available tissue-engineered vascular grafts. Sci Transl Med. 2011;3:1–11. - PubMed
Publication types
MeSH terms
Substances
Grants and funding
LinkOut - more resources
Full Text Sources
Other Literature Sources
