Generalized Lévy walks and the role of chemokines in migration of effector CD8+ T cells
- PMID: 22722867
- PMCID: PMC3387349
- DOI: 10.1038/nature11098
Generalized Lévy walks and the role of chemokines in migration of effector CD8+ T cells
Abstract
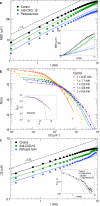
Chemokines have a central role in regulating processes essential to the immune function of T cells, such as their migration within lymphoid tissues and targeting of pathogens in sites of inflammation. Here we track T cells using multi-photon microscopy to demonstrate that the chemokine CXCL10 enhances the ability of CD8+ T cells to control the pathogen Toxoplasma gondii in the brains of chronically infected mice. This chemokine boosts T-cell function in two different ways: it maintains the effector T-cell population in the brain and speeds up the average migration speed without changing the nature of the walk statistics. Notably, these statistics are not Brownian; rather, CD8+ T-cell motility in the brain is well described by a generalized Lévy walk. According to our model, this unexpected feature enables T cells to find rare targets with more than an order of magnitude more efficiency than Brownian random walkers. Thus, CD8+ T-cell behaviour is similar to Lévy strategies reported in organisms ranging from mussels to marine predators and monkeys, and CXCL10 aids T cells in shortening the average time taken to find rare targets.
Figures


Similar articles
-
The immune system utilizes two distinct effector mechanisms of T cells depending on two different life cycle stages of a single pathogen, Toxoplasma gondii, to control its cerebral infection.Parasitol Int. 2020 Jun;76:102030. doi: 10.1016/j.parint.2019.102030. Epub 2019 Nov 25. Parasitol Int. 2020. PMID: 31778800 Free PMC article. Review.
-
Chemokine receptor CXCR3 and its ligands CXCL9 and CXCL10 are required for the development of murine cerebral malaria.Proc Natl Acad Sci U S A. 2008 Mar 25;105(12):4814-9. doi: 10.1073/pnas.0801544105. Epub 2008 Mar 17. Proc Natl Acad Sci U S A. 2008. PMID: 18347328 Free PMC article.
-
CXCL10/CXCR3-Dependent Mobilization of Herpes Simplex Virus-Specific CD8+ TEM and CD8+ TRM Cells within Infected Tissues Allows Efficient Protection against Recurrent Herpesvirus Infection and Disease.J Virol. 2017 Jun 26;91(14):e00278-17. doi: 10.1128/JVI.00278-17. Print 2017 Jul 15. J Virol. 2017. PMID: 28468883 Free PMC article.
-
CXCL10 is the key ligand for CXCR3 on CD8+ effector T cells involved in immune surveillance of the lymphocytic choriomeningitis virus-infected central nervous system.J Immunol. 2006 Apr 1;176(7):4235-43. doi: 10.4049/jimmunol.176.7.4235. J Immunol. 2006. PMID: 16547260
-
CXCR3 Ligands in Cancer and Autoimmunity, Chemoattraction of Effector T Cells, and Beyond.Front Immunol. 2020 May 29;11:976. doi: 10.3389/fimmu.2020.00976. eCollection 2020. Front Immunol. 2020. PMID: 32547545 Free PMC article. Review.
Cited by
-
Integrating mechanism-based T cell phenotypes into a model of tumor-immune cell interactions.APL Bioeng. 2024 Aug 20;8(3):036111. doi: 10.1063/5.0205996. eCollection 2024 Sep. APL Bioeng. 2024. PMID: 39175956 Free PMC article.
-
Signatures of a globally optimal searching strategy in the three-dimensional foraging flights of bumblebees.Sci Rep. 2016 Jul 27;6:30401. doi: 10.1038/srep30401. Sci Rep. 2016. PMID: 27459948 Free PMC article.
-
Evidence for a pervasive 'idling-mode' activity template in flying and pedestrian insects.R Soc Open Sci. 2015 May 20;2(5):150085. doi: 10.1098/rsos.150085. eCollection 2015 May. R Soc Open Sci. 2015. PMID: 26064664 Free PMC article.
-
Tissue-resident memory CD8+ T cells continuously patrol skin epithelia to quickly recognize local antigen.Proc Natl Acad Sci U S A. 2012 Nov 27;109(48):19739-44. doi: 10.1073/pnas.1208927109. Epub 2012 Nov 12. Proc Natl Acad Sci U S A. 2012. PMID: 23150545 Free PMC article.
-
The immune system utilizes two distinct effector mechanisms of T cells depending on two different life cycle stages of a single pathogen, Toxoplasma gondii, to control its cerebral infection.Parasitol Int. 2020 Jun;76:102030. doi: 10.1016/j.parint.2019.102030. Epub 2019 Nov 25. Parasitol Int. 2020. PMID: 31778800 Free PMC article. Review.
References
-
- Bromley SK, Mempel TR, Luster AD. Orchestrating the orchestrators: chemokines in control of T cell traffic. Nat Immunol. 2008;9:970–980. - PubMed
-
- Cyster JG. Chemokines, sphingosine-1-phosphate, and cell migration in secondary lymphoid organs. Annu Rev Immunol. 2005;23:127–159. - PubMed
-
- Ebert LM, Schaerli P, Moser B. Chemokine-mediated control of T cell traffic in lymphoid and peripheral tissues. Mol Immunol. 2005;42:799–809. - PubMed
Publication types
MeSH terms
Substances
Grants and funding
- R01 AI042334/AI/NIAID NIH HHS/United States
- CA-069212/CA/NCI NIH HHS/United States
- AI-090234/AI/NIAID NIH HHS/United States
- T32 AI007532/AI/NIAID NIH HHS/United States
- R01 AI041158-14/AI/NIAID NIH HHS/United States
- F32 AI081478/AI/NIAID NIH HHS/United States
- R01 AI041158/AI/NIAID NIH HHS/United States
- R01 CA069212/CA/NCI NIH HHS/United States
- R21 EY021314-02/EY/NEI NIH HHS/United States
- T32 AI055400/AI/NIAID NIH HHS/United States
- AI-42334/AI/NIAID NIH HHS/United States
- T32-AI-055400/AI/NIAID NIH HHS/United States
- EY-021314/EY/NEI NIH HHS/United States
- AI-41158/AI/NIAID NIH HHS/United States
- R01 NS072298/NS/NINDS NIH HHS/United States
- T32 AI007532-15/AI/NIAID NIH HHS/United States
- T32 AR007442/AR/NIAMS NIH HHS/United States
- AI-081478/AI/NIAID NIH HHS/United States
- F32 AI098374-01/AI/NIAID NIH HHS/United States
- R21 EY021314/EY/NEI NIH HHS/United States
- R21 AI090234/AI/NIAID NIH HHS/United States
- T32 AR007442-25/AR/NIAMS NIH HHS/United States
- F32 AI098374/AI/NIAID NIH HHS/United States
LinkOut - more resources
Full Text Sources
Other Literature Sources
Research Materials

