. 2012 Jun 25;197(7):921-37.
doi: 10.1083/jcb.201112117. Epub 2012 Jun 18.

Nuclear envelope morphology constrains diffusion and promotes asymmetric protein segregation in closed mitosis

Affiliations

Nuclear envelope morphology constrains diffusion and promotes asymmetric protein segregation in closed mitosis

Barbara Boettcher et al. J Cell Biol. .

Erratum in

  • J Cell Biol. 2012 Jul 9;198(1):143

Abstract

During vegetative growth, Saccharomyces cerevisiae cells divide asymmetrically: the mother cell buds to produce a smaller daughter cell. This daughter asymmetrically inherits the transcription factor Ace2, which activates daughter-specific transcriptional programs. In this paper, we investigate when and how this asymmetry is established and maintained. We show that Ace2 asymmetry is initiated in the elongated, but undivided, anaphase nucleus. At this stage, the nucleoplasm was highly compartmentalized; little exchange was observed for nucleoplasmic proteins between mother and bud. Using photobleaching and in silico modeling, we show that diffusion barriers compartmentalize the nuclear membranes. In contrast, the behavior of proteins in the nucleoplasm is well explained by the dumbbell shape of the anaphase nucleus. This compartmentalization of the nucleoplasm promoted Ace2 asymmetry in anaphase nuclei. Thus, our data indicate that yeast cells use the process of closed mitosis and the morphological constraints associated with it to asymmetrically segregate nucleoplasmic components.


Figures
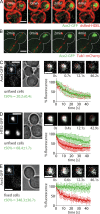
Figure 1.
Figure 1.
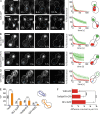
Ace2 asymmetry precedes nuclear division and is independent of Ace2 immobilization. (A and B) Ace2-GFP localization in late anaphase cells expressing dsRed-HDEL (A) or mCherry-Tub1 (B); 0 min = Ace2 asymmetry. (C–E) FLIP in daughter nuclei of Ace2-GFP (n = 9; C), HTB2-GFP (n = 9; D), or Ace2-GFP in fixed cells (n = 9; E). In images, representative daughter nuclei are shown; in graphs, fluorescence levels over time in bleached (red) and opposing nonbleached (green) quarters (means ± SD) are given. Blue boxes indicate sections of the image shown on the right. White lines indicate cell outlines. Bars: (A–E, left) 2 µm; (C–E, right) 3 µm. t50%, time to lose 50% of initial fluorescence.
Figure 2.
Figure 2.
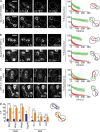
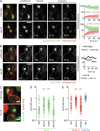
The nucleoplasm of a dumbbell-shaped nucleus is compartmentalized. (A–D) FLIP experiments on indicated reporter proteins during early and late stages of nuclear division. Mean fluorescence levels ± SD over time in the mother (red) and daughter part (green) are shown; bleaching area is indicated in blue. White lines indicate cell outlines. (E) °CP values for the indicated markers during early (blue) and late (orange) stages (for n see Table S1; means ± SEM). Numbers indicate relative increase of °CP from early to late anaphase. (F) Diffusion constants of the nucleoplasmic proteins measured by FCS (means ± SD; nTetR = 168, nTetRΔHTH = 204, and nNLS-3GFP = 179). ***, P < 0.0001 (t test). Bars, 3 µm.
Figure 3.
Figure 3.
Nuclear membranes are compartmentalized during late stages of nuclear division. (A–C) FLIP experiments on the indicated markers of the nuclear envelope during early and late anaphase. Graphs are as in Fig. 2. Mean fluorescence levels ± SD over time in the mother (red) and daughter part (green) are shown; bleaching area is indicated in blue. White lines indicate cell outlines. (D) °CP values for the indicated markers during early (blue) and late (orange) stages of nuclear division (n ≥ 13 also see Table S1; means ± SEM). Numbers indicate relative increase of °CP from early to late anaphase. Bars, 3 µm.
Figure 4.
Figure 4.
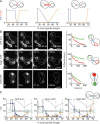
The bridge connecting the two future nuclei forms the compartments’ boundary. (A) Possible scenarios for compartment boundaries. (B) FLIP experiments on GFP-Src1, Nsg1-GFP, or TetR-GFP during late stages of nuclear division. Graphs are as in Fig. 2. Fluorescence levels for characteristic cells over time in the mother (red) and daughter part (green) are shown; bleaching area is indicated in blue. White lines indicate cell outlines. (C) °CP−1 (orange) and °CP ratios (blue) of GFP-Src1, Nsg1-GFP, and TetR-GFP plotted against the position of the bleaching region on the nuclear length axis (n = 5 per position; means ± SD). Dashed lines left to right: start of the bridge in mother, bud neck, and end of the bridge in the bud. Lines show section of the illustration on the top right, showing a cell in late anaphase with the outline of the cell and the nuclear envelope in black, the nuclear part of the spindle in green, and the spindle midzone in red. Bars, 3 µm.
Figure 5.
Figure 5.
Compartmentalization of the nucleoplasm is specifically decreased in long ase1Δ nuclei. (A) FLIP experiments on the indicated reporters in 6–7-µm-long ase1Δ nuclei. Graphs are as in Fig. 2. Mean fluorescence levels ± SD over time in the mother (red) and daughter part (green) are shown; bleaching area is indicated in blue. White lines indicate cell outlines. (B) °CP values in wild type (WT) and ase1Δ (for n see Table S1; means ± SEM). *, P < 0.05 (t test). Bars, 3 µm.
Figure 6.
Figure 6.
Changes in nuclear shape influence nucleoplasmic compartmentalization. (A) °CP of TetR-GFP, Nsg1-GFP, or GFP-Src1 in individual cells over bridge length; wild type (black) and ase1Δ (red). (B) Nsg1-GFP outlining nuclear shape in cells of the indicated genotypes. (C) °CP (for n see Table S1; means ± SEM) over bridge length normalized by a value proportional to the bridge’s cross section (means ± SD). Cells that divide the nucleus in the mother cell are indicated in red. (A and C) Lines indicate linear regression of the data point using Prism 5.0b. (D) mCherry-Tub1 spindles in wild type, ase1Δ, and cin8Δ dumbbell nuclei outlined by Nsg1-GFP. (B and D) White lines indicate cell outlines. (E) Percentage of dumbbell-shaped nuclei with (green) and without (red) mCherry-Tub1 staining (MTs) in the bridge (means ± SD; n = 3). Bars, 3 µm.
Figure 7.
Figure 7.
Averaged deviations of stochastic model simulations from the experimental mean. Deviations (in percentages) between experimental and simulated data averaged over mother and bud compartments for each experimental time step. (A–F) Simulations for early (A–C) and late (D–F) stages of nuclear division, with TetR-GFP (A and D), Nsg1-GFP (B and E), and GFP-Src1 (C and F). Color code indicates different diffusion barrier permeability. Bold lines show best overlap with experimental data; dashed lines show simulations with larger deviations.
Figure 8.
Figure 8.
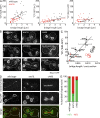
Reduction of Ace2 asymmetry in ase1Δ cells. (A) FRAP on Ace2(F127V)-GFP in cells with intact spindles. Graphs are as in Fig. 2. Mother is shown in red; daughter is shown in green. t(50%), time to recover 50% of initial fluorescence in the mother lobe (nWT = 20 and nase1Δ = 20; means ± SEM). (B) FLIP on Ace2-GFP in wild type (WT) and ase1Δ. Fluorescence levels over time in representative cells, with nonbleached nuclear lobes in the daughter in wild type (filled circles) and ase1Δ (open circles). t(50%), time to bleach 50% of initial fluorescence in the daughter nucleus (n = 20 for both; means ± SEM). The white circles label the outline of the cells in transmission light pictures, and the blue circles indicate the bleaching area. (C) Localization of Ace2-GFP in wild type and ase1Δ after nuclear division. (D) Distribution of Ace2-GFP in wild type (n = 175), ase1Δ (n = 198), cin8Δ (n = 180), and slk19Δ (n = 216). (E) Distribution of Ace2(S122A)-GFP (Ace2-A) in wild type (n = 192), ase1Δ (n = 192), and slk19Δ (n = 206) and Ace2(S122A,S137A)-GFP (Ace2-AA) in wild type (n = 199). Lines indicate the medians. ***, P < 0.0001 (t test). Bars: (A and B) 3 µm; (C) 2 µm.

Similar articles

Cited by

References

    1. Alber F., Dokudovskaya S., Veenhoff L.M., Zhang W., Kipper J., Devos D., Suprapto A., Karni-Schmidt O., Williams R., Chait B.T., et al. 2007. The molecular architecture of the nuclear pore complex. Nature. 450:695–701 10.1038/nature06405 - DOI - PubMed
    1. Andrews S.S., Addy N.J., Brent R., Arkin A.P. 2010. Detailed simulations of cell biology with Smoldyn 2.1. PLOS Comput. Biol. 6:e1000705 10.1371/journal.pcbi.1000705 - DOI - PMC - PubMed
    1. Aoki K., Hayashi H., Furuya K., Sato M., Takagi T., Osumi M., Kimura A., Niki H. 2011. Breakage of the nuclear envelope by an extending mitotic nucleus occurs during anaphase in Schizosaccharomyces japonicus. Genes Cells. 16:911–926 10.1111/j.1365-2443.2011.01540.x - DOI - PubMed
    1. Bacia K., Schwille P. 2003. A dynamic view of cellular processes by in vivo fluorescence auto- and cross-correlation spectroscopy. Methods. 29:74–85 10.1016/S1046-2023(02)00291-8 - DOI - PubMed
    1. Basson M.E., Thorsness M., Rine J. 1986. Saccharomyces cerevisiae contains two functional genes encoding 3-hydroxy-3-methylglutaryl-coenzyme A reductase. Proc. Natl. Acad. Sci. USA. 83:5563–5567 10.1073/pnas.83.15.5563 - DOI - PMC - PubMed

Publication types

MeSH terms

Substances

LinkOut - more resources