Hepatitis C virus induced a novel apoptosis-like death of pancreatic beta cells through a caspase 3-dependent pathway
- PMID: 22675572
- PMCID: PMC3366942
- DOI: 10.1371/journal.pone.0038522
Hepatitis C virus induced a novel apoptosis-like death of pancreatic beta cells through a caspase 3-dependent pathway
Abstract
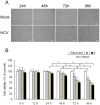
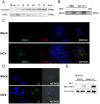
Epidemiological and experimental studies have suggested that Hepatitis C virus (HCV) infection is associated with the development of type 2 diabetes. Pancreatic beta cell failure is central to the progression of type 2 diabetes. Using virus infection system, we investigate the influence of HCV infection on the fate of the insulinoma cell line, MIN6. Our experiments demonstrate that the HCV virion itself is indispensable and has a dose- and time-dependent cytopathic effect on the cells. HCV infection inhibits cell proliferation and induces death of MIN6 cells with apoptotic characteristics, including cell surface exposure of phosphatidylserine, decreased mitochondrial membrane potential, activation of caspase 3 and poly (ADP-ribose) polymerase, and DNA fragmentation in the nucleus. However, the fact that HCV-infected cells exhibit a dilated, low-density nucleus with intact plasma and nuclear membrane indicates that a novel apoptosis-like death occurs. HCV infection also causes endoplasmic reticulum (ER) stress. Further, HCV RNA replication was detected in MIN6 cells, although the infection efficiency is very low and no progeny virus particle generates. Taken together, our data suggest that HCV infection induces death of pancreatic beta cells through an ER stress-involved, caspase 3-dependent, special pathway.
Conflict of interest statement
Figures


Similar articles
-
Hepatitis C virus infection induces apoptosis through a Bax-triggered, mitochondrion-mediated, caspase 3-dependent pathway.J Virol. 2008 Nov;82(21):10375-85. doi: 10.1128/JVI.00395-08. Epub 2008 Sep 3. J Virol. 2008. PMID: 18768989 Free PMC article.
-
Nonstructural 3 Protein of Hepatitis C Virus Modulates the Tribbles Homolog 3/Akt Signaling Pathway for Persistent Viral Infection.J Virol. 2016 Jul 27;90(16):7231-7247. doi: 10.1128/JVI.00326-16. Print 2016 Aug 15. J Virol. 2016. PMID: 27252525 Free PMC article.
-
Pyruvate kinase M1 interacts with A-Raf and inhibits endoplasmic reticulum stress-induced apoptosis by activating MEK1/ERK pathway in mouse insulinoma cells.Cell Signal. 2017 Oct;38:212-222. doi: 10.1016/j.cellsig.2017.07.017. Epub 2017 Jul 22. Cell Signal. 2017. PMID: 28743549
-
Hepatitis C Virus Infection Induces Autophagy as a Prosurvival Mechanism to Alleviate Hepatic ER-Stress Response.Viruses. 2016 May 23;8(5):150. doi: 10.3390/v8050150. Viruses. 2016. PMID: 27223299 Free PMC article. Review.
-
Hepatitis C virus and cellular stress response: implications to molecular pathogenesis of liver diseases.Viruses. 2012 Oct 19;4(10):2251-90. doi: 10.3390/v4102251. Viruses. 2012. PMID: 23202463 Free PMC article. Review.
Cited by
-
Different responses of two highly permissive cell lines upon HCV infection.Virol Sin. 2013 Aug;28(4):202-8. doi: 10.1007/s12250-013-3342-5. Epub 2013 Jun 27. Virol Sin. 2013. PMID: 23818110 Free PMC article.
-
Iron homeostasis and insulin sensitivity: unraveling the complex interactions.Rev Endocr Metab Disord. 2024 Oct;25(5):925-939. doi: 10.1007/s11154-024-09908-7. Epub 2024 Sep 17. Rev Endocr Metab Disord. 2024. PMID: 39287729 Free PMC article. Review.
-
Kynurenine Metabolism and Alzheimer's Disease: The Potential Targets and Approaches.Neurochem Res. 2022 Jun;47(6):1459-1476. doi: 10.1007/s11064-022-03546-8. Epub 2022 Feb 8. Neurochem Res. 2022. PMID: 35133568 Review.
-
Immune regulation of the unfolded protein response at the mucosal barrier in viral infection.Clin Transl Immunology. 2018 Apr 3;7(4):e1014. doi: 10.1002/cti2.1014. eCollection 2018. Clin Transl Immunology. 2018. PMID: 29632667 Free PMC article. Review.
-
Suppressor of cytokine signalling-2 limits IGF1R-mediated regulation of epithelial-mesenchymal transition in lung adenocarcinoma.Cell Death Dis. 2018 Apr 1;9(4):429. doi: 10.1038/s41419-018-0457-5. Cell Death Dis. 2018. PMID: 29559623 Free PMC article.
References
-
- Lauer GM, Walker BD. Hepatitis C virus infection. N Engl J Med. 2001;345:41–52. - PubMed
-
- Kiyosawa K, Sodeyama T, Tanaka E, Gibo Y, Yoshizawa K, et al. Interrelationship of blood transfusion, non-A, non-B hepatitis and hepatocellular carcinoma: analysis by detection of antibody to hepatitis C virus. Hepatology. 1990;12:671–675. - PubMed
-
- Pawlotsky JM. Pathophysiology of hepatitis C virus infection and related liver disease. Trends Microbiol. 2004;12:96–102. - PubMed
-
- Gumber SC, Chopra S. Hepatitis C: a multifaceted disease. Review of extrahepatic manifestations. Ann Intern Med. 1995;123:615–620. - PubMed
Publication types
MeSH terms
Substances
LinkOut - more resources
Full Text Sources
Research Materials

