. 2012;7(6):e36712.
doi: 10.1371/journal.pone.0036712. Epub 2012 Jun 1.

LSDP5 enhances triglyceride storage in hepatocytes by influencing lipolysis and fatty acid β-oxidation of lipid droplets

Affiliations

LSDP5 enhances triglyceride storage in hepatocytes by influencing lipolysis and fatty acid β-oxidation of lipid droplets

Hang Li et al. PLoS One. 2012.

Abstract

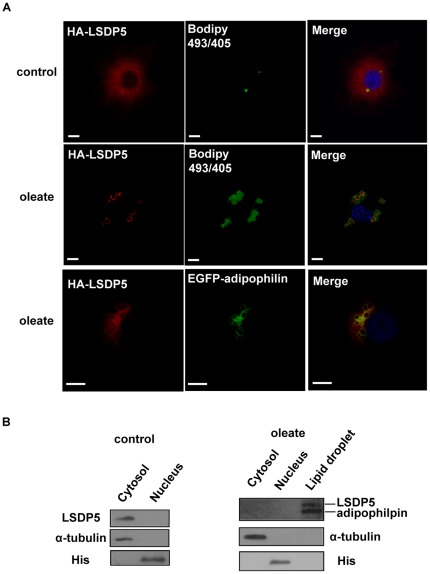
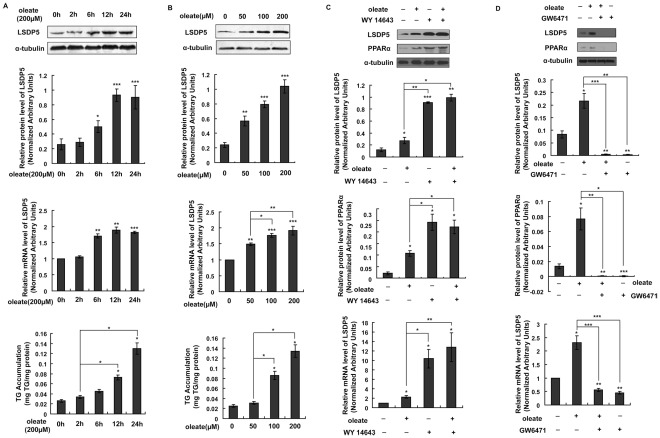
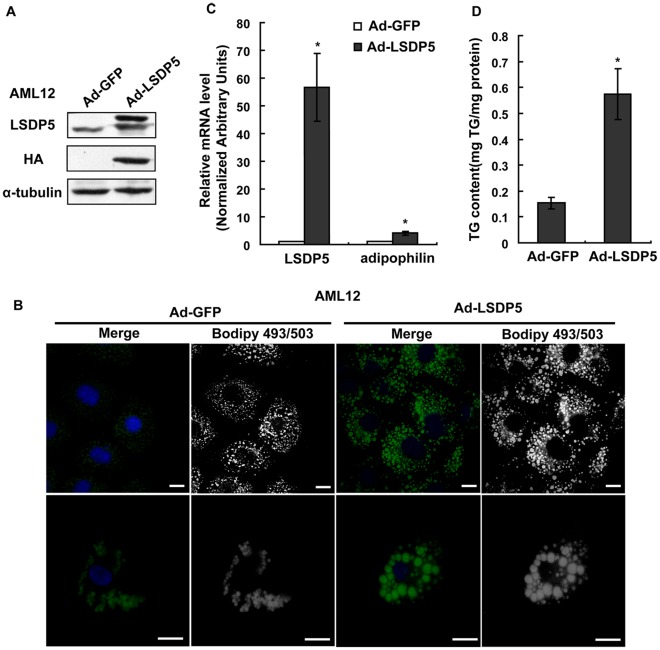
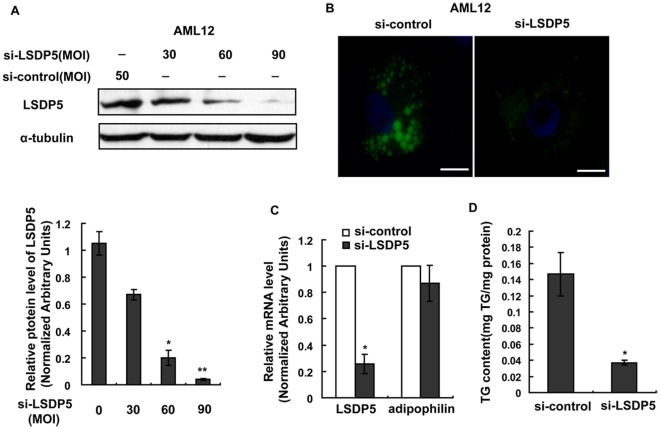
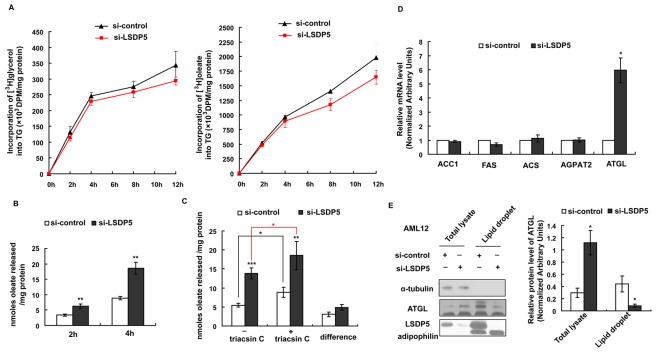
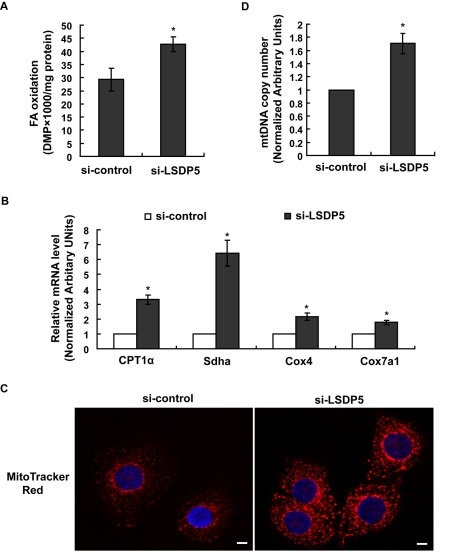
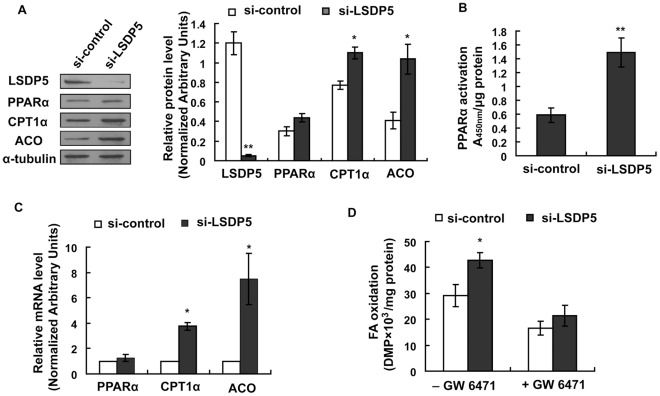
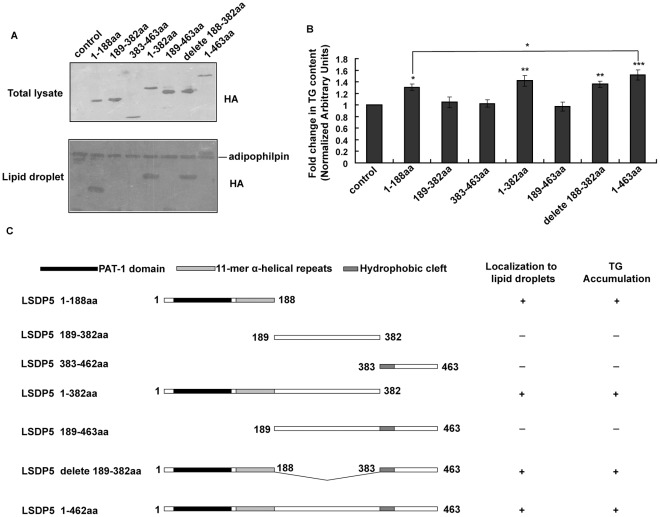
Lipid storage droplet protein 5 (LSDP5) is a lipid droplet-associated protein of the PAT (perilipin, adipophilin, and TIP47) family that is expressed in the liver in a peroxisome proliferator-activated receptor alpha (PPARα)-dependent manner; however, its exact function has not been elucidated. We noticed that LSDP5 was localized to the surface of lipid droplets in hepatocytes. Overexpression of LSDP5 enhanced lipid accumulation in the hepatic cell line AML12 and in primary hepatocytes. Knock-down of LSDP5 significantly decreased the triglyceride content of lipid droplets, stimulated lipolysis, and modestly increased the mitochondrial content and level of fatty-acid β-oxidation in the mitochondria. The expression of PPARα was increased in LSDP5-deficient cells and required for the increase in the level of fatty acid β-oxidation in LSDP5-deficient cells. Using serial deletions of LSDP5, we determined that the lipid droplet-targeting domain and the domain directing lipid droplet clustering overlapped and were localized to the 188 amino acid residues at the N-terminus of LSDP5. Our findings suggest that LSDP5, a novel lipid droplet protein, may contribute to triglyceride accumulation by negatively regulating lipolysis and fatty acid oxidation in hepatocytes.


Conflict of interest statement

Competing Interests: The authors have declared that no competing interests exist.

Figures

Figure 1
Figure 1. LSDP5 was recruited to lipid droplets.
(A) AML12 cells were transiently transfected with HA-tagged LSDP5 and incubated with BSA (control) or oleate (100 µM) overnight. The cells were stained with an anti-HA antibody with BODIPY 493/503 for visualizing lipids (green) and Hoechst 33258 for visualizing nuclei (blue). Left panels show the immunofluorescent signal (red), middle panels showed BODIPY staining (green), and right panels show the merged images. HA-LSDP5 exhibited a steady-state faint cytoplasmic staining and decorated lipid droplets after incubating the cells in oleate-rich medium. AML12 cells were co-transfected with HA-LSDP5 and EGFP-adipophilin. The cells were incubated with a mouse anti-HA antibody (primary antibody) and a Cy3-conjugated anti-mouse antibody (secondary antibody). The samples were detected by fluorescence microscopy (Olympus, Temecula, CA). The results show the co-localization of LSDP5 with adipophilin, a lipid droplet-targeted protein (last row). Scale bar = 5 µm. (B) LSDP5 was enriched in lipid droplet fractions. α-tubulin, a cytosol marker; His, a nucleus marker; and adipophilin, a lipid droplet marker. 5 mg of each fraction was loaded for immunoblot analysis.
Figure 2
Figure 2. The effect of oleate exposure on the expression of LSDP5.
(A) AML12 cells were incubated with 200 µM oleate for the indicated time. Representative Western blots are shown (top panel), and LSDP5 transcript levels were measured using real-time PCR (middle panel). Expression levels of LSDP5 are expressed as a ratio to α-tubulin (representative of three experiments). * P<0.05, ** P<0.01, *** P<0.001. The relative mRNA level before oleate exposure (0 h) was designated as 1.0. n = 6, ** P<0.01, *** P<0.001. The amount of TGs in AML12 cells treated with oleate for different times was assessed with a TG test kit, and is expressed as mg TG/mg protein (bottom panel). n = 5, * P<0.05, ** P<0.01, *** P<0.001. Data are presented as the mean±SEM. (B) AML12 cells were incubated with different concentrations of oleate (0, 50, 100, and 200 µM) for 24 h. Protein extracts were analyzed by Western blotting (top panel), and total RNA was subjected to real-time PCR (middle panel). n = 6,* P<0.05, ** P<0.01, *** P<0.001. The amount of TGs in AML12 cells treated with different concentration of oleate was assessed with a TG test kit (bottom panel). n = 5, * P<0.05. Data are presented as the mean±SEM. (C,D) Effect of WY14643 or GW6471 on oleate-induced LSDP5 expression in AML12 cells. AML12 cells were exposed to oleate (200 µM) in the absence or presence of WY 14643 (30 µM) or GW6471 (10 µM) for 24 h. The expression of LSDP5 (top panel) and PPARα (middle panel) was monitored by Western blotting. LSDP5 transcript levels were measured using real-time PCR (bottom panel). The relative mRNA level of AML12 cells in equivalent amounts of BSA was designated as 1.0. Data are presented as the mean±SEM (n = 4–6), * P<0.05, ** P<0.01, *** P<0.001 (Dunnett’s post hoc test following a one-way ANOVA).
Figure 3
Figure 3. The overexpression of LSDP5 increased cellular TG storage in AML12 cells.
(A) Adenovirus-mediated HA-LSDP5 overexpression in AML12 cells was confirmed by Western blotting. Expression levels of LSDP5 are expressed as a ratio to α-tubulin (representative of three experiments). (B) AML12 cells were infected with adenovirus encoding LSDP5 for 6 h and then incubated with 200 µM oleate for 24 h. Neutral lipids were stained with BODIPY 493/503, and nuclei were labeled with Hoechst 33258. The immunofluorescent signals of both BODIPY 493/503 (green) and Hoechst 33258 (blue) are shown in the merged panels. The BODIPY immunofluorescent signals are shown in the BODIPY493/503 panels and were edited to grayscale to provide clearer lipid signals and reduce interference from the immunofluorescent signal of the nucleus. Scale bar = 15 µm. (C) The relative mRNA levels of LSDP5 and adipophilin were assessed using real-time PCR. Data are presented as the mean±SEM (n = 4), * P<0.05. (D) A higher concentration of TGs was observed in cells overexpressing LSDP5 compared with controls. Data are presented as the mean±SEM (n = 5), * P<0.05. Data in this figure were analyzed with paired Student’s t test.
Figure 4
Figure 4. LSDP5 deficiency inhibited TG accumulation in AML12 cells.
AML12 cells were infected with an adenovirus carrying LSDP5 siRNA for 24 h and then incubated with 200 µM oleate for another 24 h. (A) Western blotting revealed that the adenovirus (si-LSDP5) at a multiplicity of infection (MOI) of 90 successfully silenced LSDP5 in AML12 cells (>95% knock-down). Expression levels of LSDP5 are expressed as a ratio to α-tubulin (representative of three experiments). Data are presented as the mean±SEM. * P<0.05, ** P<0.01 (Dunnett’s post hoc test following a one-way ANOVA). (B) BODIPY staining of AML12 cells expressing control siRNA (left) or LSDP5 siRNA (right). Scale bar = 15 µm. (C) The mRNA levels of LSDP5 and adipophilin were assessed with real-time PCR. The relative mRNA level in AML12 cells infected with an adenovirus containing control siRNA was designated as 1.0. Data are presented as the mean±SEM (n = 4), * P<0.05. (D) A lower concentration of TGs was detected in si-LSDP5 cells, compared with control cells. Data are presented as the mean±SEM (n = 5), * P<0.05 (paired Student’s t test).
Figure 5
Figure 5. Triglyceride synthesis and lipolysis in AML12 cells lacking LSDP5.
(A) Incorporation of [3H]-glycerol or [3H]-oleate into TG in control and si-LSDP5 cells. Data were normalized to the number of cells and are expressed as the mean±SEM (n = 4). (B) Time courses of [3H]-oleate release from si-control and si-LSDP5 cells. Trypan blue staining was used to count the living cells. Data were normalized based on cell viability and total protein content. Data are presented as the mean±SEM (n = 4), ** P<0.01. (C) The effect of LSDP5 silencing on re-esterificaiton and hydrolysis. After lipid loading, the [3H]-oleate release after 4 h with or without triacsin C was assessed. The efflux of [3H]-oleate without triacsin C reflected the total lipolysis level, the efflux of [3H]-oleate with triacsin C reflected the TG hydrolysis level, and the difference between TG hydrolysis and total lipolysis reflected the level of re-esterification. Data were normalized based on cell viability and total protein level. Data are presented as the mean±SEM (n = 4–5), * P<0.05. (D) The mRNA levels of ACC1, FAS, ACS, AGPAT and ATGL were assessed using real-time PCR. The relative mRNA level in the control group was designated as 1.0. Data are presented as the mean±SEM (n = 6), * P<0.05. (E) Lipid droplet fractions were isolated by subcellular fractionation and analyzed by immunoblotting for LSDP5, adipophilin, and ATGL. 20 mg of total hepatocyte lysate and 5 mg of lipid fraction were loaded for immunoblotting analysis. Expression levels of ATGL are expressed as a ratio to α-tubulin in the total lysate and as a ratio to adipophilpin on lipid droplets (representative of four experiments). Data are presented as the mean±SEM, * P<0.05. Data in this figure were analyzed with paired Student’s t tests.
Figure 6
Figure 6. Depletion of LSDP5 increased fatty acid β-oxidation and the number of mitochondria.
AML12 cells were infected with adenovirus carrying LSDP5 siRNA (MOI = 90) or an adenovirus carrying control siRNA for 24 h. (A) β-oxidation of [3H]-oleate in si-control or si-LSDP5 cells. Data are presented as the mean±SEM (n = 4), *P<0.05. (B) The mRNA levels of CPT1α, Sdha, Cox4 and Cox7a1 were assessed using real-time PCR. The relative mRNA level in the control group was designated as 1.0. Data are presented as the mean±SEM (n = 5), *P<0.05. (C) Mitochondria in hepatocytes containing control-siRNA or LSDP5-siRNA were stained with MitoTracker Red. Nuclei were labeled with Hoechst 33258. Scale bar = 5 µm. *P<0.05. (D) Changes in the copy number of mtDNA were assessed with real-time PCR. The relative amount of mtDNA was calculated as the normalized ratio of NADH dehydrogenase subunit I/lipoprotein lipase, and the relative mtDNA copy number in the control group was designated as 1.0. Data are presented as the mean±SEM (n = 4), * P<0.05. Data in this figure were analyzed with paired Student’s t tests.
Figure 7
Figure 7. Effect of LSDP5 silencing on PPARα expression and activity.
(A) A representative immunoblot for PPARα, LSDP5, CPT1α and ACO as detected by chemiluminescence. Expression levels of each protein are expressed as a ratio to α-tubulin (representative of four experiments). Data are presented as the mean±SEM, * P<0.05, ** P<0.01. (B) PPARα activity was determined by a binding assay using nuclear protein from si-control and si-LSDP5 cells and an oligonucleotide corresponding to the PPARα consensus sequence. The activity of PPARα significantly increased when LSDP5 was knocked down. The results are presented as the absorbance at 450 nm (A450) wave length/µg protein. Data are presented as the mean±SEM (n = 5), * P<0.05. (C) Quantitative analysis of the mRNA level of using LSDP5, CPT1α and ACO as determined by real-time PCR and expressed relative to the corresponding siRNA control group. Data are presented as the mean±SEM of three independent experiments. (D) Effect of GW6541 on increased β-oxidation in LSDP5-depleted hepatocytes. Data are presented as the mean±SEM (n = 5), * P<0.05. Data in this figure were analyzed with paired Student’s t tests.
Figure 8
Figure 8. Effect of LSDP5 constructs on lipid accumulation.
(A) 293T cells transfected with truncated HA-LSDP5 were incubated with 100 µM oleate overnight to enlarge the lipid droplets. Upper panel: The total lysates were subjected to Western blot analysis. An anti-HA antibody was used to show the expression levels of the HA-LSDP5 truncations used in the experiment. Lower panel: the lipid fraction was isolated by subcellular fractionation and analyzed by immunoblotting with HA and adipophilin antibodies. (B) The amount of TGs in cells transfected with truncated LSDP5 was quantified using a TG test kit. The TG content under each condition was normalized to the cellular protein level and expressed as a fold change compared with the control (pCMV5-HA). Values were normalized to 1.0. Data are presented as the mean±SEM (n = 5), * P<0.05, ** P<0.01, *** P<0.001 (Dunnett’s post hoc test following a one-way ANOVA). (C) Schematic illustration of the roles of truncated forms of LSDP5 in lipid targeting and lipid accumulation.

Similar articles

Cited by

References

    1. Friedman JM. Obesity: Causes and control of excess body fat. Nature. 2009;459:340–342. - PubMed
    1. Unger RH. Lipotoxic diseases. Annu Rev Med. 2002;53:319–336. - PubMed
    1. Ducharme NA, Bickel PE. Lipid droplets in lipogenesis and lipolysis. Endocrinology. 2008;149:942–949. - PubMed
    1. Murphy DJ, Vance J. Mechanisms of lipid-body formation. Trends Biochem Sci. 1999;24:109–115. - PubMed
    1. Olofsson SO, Bostrom P, Andersson L, Rutberg M, Perman J, et al. Lipid droplets as dynamic organelles connecting storage and efflux of lipids. Biochim Biophys Acta. 2009;1791:448–458. - PubMed

Publication types

MeSH terms