. 2012 Jun 6:3:875.
doi: 10.1038/ncomms1867.

Differentiation of multipotent vascular stem cells contributes to vascular diseases

Affiliations

Differentiation of multipotent vascular stem cells contributes to vascular diseases

Zhenyu Tang et al. Nat Commun. .

Abstract

It is generally accepted that the de-differentiation of smooth muscle cells, from the contractile to the proliferative/synthetic phenotype, has an important role during vascular remodelling and diseases. Here we provide evidence that challenges this theory. We identify a new type of stem cell in the blood vessel wall, named multipotent vascular stem cells. Multipotent vascular stem cells express markers, including Sox17, Sox10 and S100β, are cloneable, have telomerase activity, and can differentiate into neural cells and mesenchymal stem cell-like cells that subsequently differentiate into smooth muscle cells. On the other hand, we perform lineage tracing with smooth muscle myosin heavy chain as a marker and find that multipotent vascular stem cells and proliferative or synthetic smooth muscle cells do not arise from the de-differentiation of mature smooth muscle cells. In response to vascular injuries, multipotent vascular stem cells, instead of smooth muscle cells, become proliferative, and differentiate into smooth muscle cells and chondrogenic cells, thus contributing to vascular remodelling and neointimal hyperplasia. These findings support a new hypothesis that the differentiation of multipotent vascular stem cells, rather than the de-differentiation of smooth muscle cells, contributes to vascular remodelling and diseases.


Conflict of interest statement

Conflict of financial interest

The authors declared no conflict of financial interest.

Figures
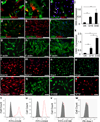
Figure 1
Figure 1. Characterization of SM-MHC cells isolated from rat carotid arterial tunica media
(a-c) Cells were isolated from arterial tunica media by using enzymatic digestion method. The derived cells were immunostained for SMA, SM-MHC, CNN1 and Ki67 after being cultured in DMEM with 10% FBS for 3 days. Arrow in b indicates a SM-MHC cell. Arrows in c indicate proliferating SM-MHC cells in culture. Arrowhead in c indicates a non-proliferative mature SMC. (d-f) Cells were isolated from arterial tunica media by using tissue explant culture method. The derived cells were immunostained for SMA, Ki67, SM-MHC and CNN1 after being cultured in DMEM with 10% FBS for 3 days. (g-k) SM-MHC cells were cultured in DMEM with 10% FBS for 5, 15 and 30 days, and either subjected to FITC-phalloidin staining for F-actin (g-i) (Nuclei were stained with DAPI) or used for qPCR to measure the gene expression of SMA and CNN1 (j-k). 18S rRNA was used to normalize the relative expression levels. Data were shown as average ± standard deviation (n=3). * indicates significant difference between indicated groups by using Holm’s t-test. (p<0.01). (l-s) Immunostaining of isolated SM-MHC cells cultured in DMEM with 10% FBS for 3 days for various markers, including Sox10, Sox17, Sox1, Snail, vimentin, nestin, S100β and NFM. (t-w) Flow cytometry analysis of SM-MHC cells derived from arterial tunica media cultured in DMEM with 10% FBS for 3 days with antibodies against CD29, CD44, CD146 and Sca-1. Filled grey curves represent negative control samples, red curves represent samples stained with antibodies for CD29 (t), CD44 (u), CD146 (v) or Sca-1 (w). Scale bars are 100 µm.
Figure 2
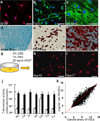
Figure 2. Differentiation assay, single cell cloning and telomerase activity assay of SM-MHC cells derived from rat carotid arterial tunica media
(a-f) Staining of differentiated cell derived from SM-MHC cells: Schwann cells for GFAP (a), neurons for TUJ1 (b), SMCs for SM-MHC (c), chondrocytes for aggrecan by using alcian blue (d), adipocytes for lipid droplets by using oil red (e) and osteoblasts for calcified matrix by using alizarin red (f). Scale bars of a-c are 50 µm. Scale bars of d-f are 100 µm. (g) Schematic illustration of single cell cloning with maintenance media. (h-i) Immunostaining of cloned MVSCs for Sox10 and Sox17. (j) Telomerase activity assay of MVSCs and the tissues from which MVSCs were isolated. The data was shown as average ± standard deviation (n=3). White bars indicate tissues and black bars indicate isolated MVSCs. * indicates significant difference between MVSCs and the tissue from which the cells were derived by using Student’s t-test (p<0.05). † indicates significant difference between inferior vena cava and other blood vessels by using Holm’s t-test (p<0.05). AO: aorta, CA: carotid artery, JV: jugular vein, AA: abdominal artery, IVC: inferior vena cava, FA: femoral artery, FV: femoral vein. (k) DNA microarray analysis of MVSCs derived from rat carotid arteries and jugular veins (n=3).
Figure 3
Figure 3. Characterization of MVSCs derived from mouse blood vessels by using lineage tracing model with SM-MHC and Wnt1 as markers
(a) A cross-section of carotid artery from SM-MHC-Cre/LoxP-EGFP mouse was immunostained for EGFP (green) and SMA (red). The arrow indicates a SM-MHC cell inside tunica media. Scale bar is 50 µm. (b-c) Flow cytometry analysis for EGFP of cells derived from carotid arteries of SM-MHC-Cre/LoxP-EGFP mice by using enzymatic digestion method at day 0 (b) (n=3) and day 10 (c) (n=3), with the cells cultured in DMEM with 10% FBS . (d-e) Phase contrast and fluorescent images of tissue explant culture of carotid arterial tissue from SM-MHC-Cre/LoxP-EGFP mice. Scale bars are 100 µm. (f) Flow cytometry analysis for EGFP expression in the cells derived in d-e (n=6). (g) Immunostaining of the EGFP cells derived from carotid arteries of SM-MHC-Cre/LoxP-EGFP mice for Sox10. Scale bar is 100 µm. (h-l) Staining of differentiated cells derived from EGFP cells: Schwann cells for GFAP and S100β (h), neurons for TUJ1 and peripherin (i), chondrocytes for aggrecan by using alcian blue (j), adipocytes for lipid droplets by using oil red (k) and osteoblasts for calcified matrix by using alizarin red (l). Scale bars of i-j are 50 µm. Scale bars of k-m are 100 µm. (m) EGFP expression in MVSCs after being co-cultured with OP9-Delta1 cell line for 2 weeks. Scale bar is 50 µm. (n-o) X-Gal staining of MVSCs derived from carotid arteries (n) and jugular veins (o) of Wnt1-Cre/LoxP-lacZ mouse. Scale bars are 50 µm.
Figure 4
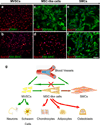
Figure 4. Spontaneous differentiation of MVSCs into MSC-like cells and SMCs
(a-f) MVSCs were cultured in DMEM with 10% FBS for 5 (a-b), 3 weeks (c-d) and 8 weeks (e-f), and were immunostained for Sox17, CNN1, SM-MHC and Sox10. Scale bar is 100 µm. The nuclei were stained with DAPI. (g) Schematic illustration of the spontaneous differentiation of MVSCs and the differentiation potential of the cells at different stages.
Figure 5
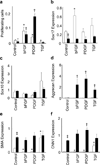
Figure 5. Differential response of MVSCs and MSC-like cells to the treatment of vascular growth factors
The undifferentiated MVSCs (cultured in DMEM with 10% FBS for 5 days) and MSC-like cells (cultured in DMEM with 10% FBS for 3 weeks) were treated with 10 ng/ml bFGF, 10 ng/ml PDGF-B or 10ng/ml TGF-β1 for 24 hours. White bars indicate undifferentiated MVSCs and black bars indicate MSC-like cells. (a) EdU staining was used to quantify the proliferating cells. (b-f) Quantitative PCR analysis was used to quantify the gene expression of Sox17 (b), Sox10 (c), aggrecan (d), SMA (e) and CNN1 (f). 18S rRNA was used to normalize the relative expression levels. Data were shown as average ± standard deviation (n=3). * indicates significant difference between growth factors-treated and untreated MVSCs by using Holm’s t-test (p<0.05). † indicates significant difference between growth factor-treated and untreated MSC-like cells by using Holm’s t-test (p<0.05). ‡ indicates significant difference between MVSCs and MSC-like cells in absence of growth factors by using Student’s t-test (p<0.05).
Figure 6
Figure 6. MVSC activation in vitro and in vivo
(a-c) MVSCs were isolated from rat carotid arteries by using enzymatic digestion method, and cultured in DMEM with 10% FBS for 24 hours (a) and 48 hours (b-c). The cells were immunostained for SMA, Ki67 and Sox10. Scale bar is 100 µm. (d-l) Immunostaining of cross-sections from native carotid arteries (d-f) and injured carotid arteries (day 5) (g-o) with the antibodies against Sox10, SMA, Ki67, S100β and NFM. A: Adventitia, L: Lumen, M: Media. The nuclei were stained with DAPI. Scale bars are 50 µm.
Figure 7
Figure 7. MVSCs instead of SMCs contributed to vascular remodeling and neointima formation after endothelial denudation injury
(a-f) Immunostaining of cross-sections of native carotid arteries (a-c) and injured carotid arteries (day 5) (d-f) from SM-MHC-Cre/LoxP-EGFP mice with the antibodies against EGFP and S100β. (g-l) Immunostaining of cross-sections from carotid arteries of SD rats at day 15 after injury with the antibodies against Sox10, Ki67, S100β and NFM. (m-o) Immunostaining of cross sections of carotid arteries from SD rats at day 30 after injury with the antibodies against S100β and SM-MHC. Scale bars are 50 µm. The nuclei were stained with DAPI. A: adventitia, I: intima, L: lumen, M: media.
Figure 8
Figure 8. Characterization of MVSCs from neointima in rat and MVSCs from normal human carotid artery
(a) Alcian blue staining of a cross-section of carotid artery from SD rat at week 5 after injury. Square indicates the area where the cells were isolated. Scale bar is 50 µm. (b-c) The cells isolated from neointima in rat were stained for MVSC markers Sox10 and Sox17. Scale bars are 50 µm. (d-i) The cells isolated from neointima were subjected to differentiation assays and stained for SMC markers SM-MHC and CNN1 (d), Schwann cell markers GFAP and S100β (e), neuronal marker TUJ1 and peripherin (f), aggrecan in chondrogenic culture by using alcian blue (g), oil droplets in adipogenic culture by using oil red (h), and calcified matrix in osteoblastic culture by using alizarin red) (i). Scale bars of d-f are 50 µm. Scale bars of g-i are 100 µm. (j-o) Immunostaining of MVSCs isolated from human carotid arteries with antibodies against Sox10, Sox17, Pax-3/7, vimentin, NFM and S100β. Scale bars are 100 µm.

Similar articles

Cited by

References

    1. Ross R. Atherosclerosis--an inflammatory disease. N Engl J Med. 1999;340:115–126. - PubMed
    1. Libby P. Inflammation in atherosclerosis. Nature. 2002;420:868–874. - PubMed
    1. Hansson GK. Inflammation, atherosclerosis, and coronary artery disease. N Engl J Med. 2005;352:1685–1695. - PubMed
    1. Weissberg PL, Clesham GJ, Bennett MR. Is vascular smooth muscle cell proliferation beneficial? Lancet. 1996;347:305–307. - PubMed
    1. Ang AH, Tachas G, Campbell JH, Bateman JF, Campbell GR. Collagen synthesis by cultured rabbit aortic smooth-muscle cells. Alteration with phenotype. Biochem J. 1990;265:461–469. - PMC - PubMed

Publication types