Dynamic gene expression in the human cerebral cortex distinguishes children from adults
- PMID: 22666384
- PMCID: PMC3364291
- DOI: 10.1371/journal.pone.0037714
Dynamic gene expression in the human cerebral cortex distinguishes children from adults
Abstract
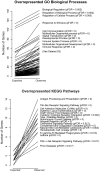
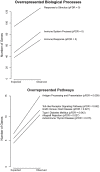
In comparison with other primate species, humans have an extended juvenile period during which the brain is more plastic. In the current study we sought to examine gene expression in the cerebral cortex during development in the context of this adaptive plasticity. We introduce an approach designed to discriminate genes with variable as opposed to uniform patterns of gene expression and found that greater inter-individual variance is observed among children than among adults. For the 337 transcripts that show this pattern, we found a significant overrepresentation of genes annotated to the immune system process (pFDR ~/= 0). Moreover, genes known to be important in neuronal function, such as brain-derived neurotrophic factor (BDNF), are included among the genes more variably expressed in childhood. We propose that the developmental period of heightened childhood neuronal plasticity is characterized by more dynamic patterns of gene expression in the cerebral cortex compared to adulthood when the brain is less plastic. That an overabundance of these genes are annotated to the immune system suggests that the functions of these genes can be thought of not only in the context of antigen processing and presentation, but also in the context of nervous system development.
Conflict of interest statement
Figures


Similar articles
-
Whole transcriptome sequencing of the aging rat brain reveals dynamic RNA changes in the dark matter of the genome.Age (Dordr). 2013 Jun;35(3):763-76. doi: 10.1007/s11357-012-9410-1. Epub 2012 May 4. Age (Dordr). 2013. PMID: 22555619 Free PMC article.
-
Transcriptomic landscape, gene signatures and regulatory profile of aging in the human brain.Biochim Biophys Acta Gene Regul Mech. 2020 Jun;1863(6):194491. doi: 10.1016/j.bbagrm.2020.194491. Epub 2020 Feb 8. Biochim Biophys Acta Gene Regul Mech. 2020. PMID: 32006715
-
Changes in alternative brain-derived neurotrophic factor transcript expression in the developing human prefrontal cortex.Eur J Neurosci. 2009 Apr;29(7):1311-22. doi: 10.1111/j.1460-9568.2009.06669.x. Epub 2009 Mar 23. Eur J Neurosci. 2009. PMID: 19519623
-
BDNF transcripts, proBDNF and proNGF, in the cortex and hippocampus throughout the life span of the rat.Age (Dordr). 2013 Dec;35(6):2057-70. doi: 10.1007/s11357-012-9495-6. Epub 2012 Dec 21. Age (Dordr). 2013. PMID: 23255148 Free PMC article.
-
Lithium Distinctly Modulates the Secretion of Pro- and Anti- Inflammatory Interleukins in Co-Cultures of Neurons and Glial Cells at Therapeutic and Sub-Therapeutic Concentrations.Curr Alzheimer Res. 2016;13(8):848-52. doi: 10.2174/1567205013666160219112612. Curr Alzheimer Res. 2016. PMID: 26892291 Review.
Cited by
-
Excess of homozygosity in the major histocompatibility complex in schizophrenia.Hum Mol Genet. 2014 Nov 15;23(22):6088-95. doi: 10.1093/hmg/ddu308. Epub 2014 Jun 18. Hum Mol Genet. 2014. PMID: 24943592 Free PMC article.
-
Longitudinal epigenetic variation of DNA methyltransferase genes is associated with vulnerability to post-traumatic stress disorder.Psychol Med. 2014 Nov;44(15):3165-79. doi: 10.1017/S0033291714000968. Epub 2014 Apr 25. Psychol Med. 2014. PMID: 25065861 Free PMC article.
-
Evolution and transition of expression trajectory during human brain development.BMC Evol Biol. 2020 Jun 23;20(1):72. doi: 10.1186/s12862-020-01633-4. BMC Evol Biol. 2020. PMID: 32576137 Free PMC article.
-
Pharmacogenomics in Psychiatry Practice: The Value and the Challenges.Int J Mol Sci. 2022 Nov 3;23(21):13485. doi: 10.3390/ijms232113485. Int J Mol Sci. 2022. PMID: 36362270 Free PMC article. Review.
-
Modular and coordinated expression of immune system regulatory and signaling components in the developing and adult nervous system.Front Cell Neurosci. 2015 Aug 28;9:337. doi: 10.3389/fncel.2015.00337. eCollection 2015. Front Cell Neurosci. 2015. PMID: 26379506 Free PMC article.
References
-
- Tomasello M. Cambridge, MA: Harvard University Press; 2001. The cultural origins of human cognition.
-
- Yirmiya R, Goshen I. Immune modulation of learning, memory, neural plasticity and neurogenesis. Brain Behav Immun. 2011;25:181–213. - PubMed
-
- Berlucchi G, Buchtel HA. Neuronal plasticity: historical roots and evolution of meaning. Exp Brain Res. 2009;192:307–319. - PubMed
-
- Allman JM. New York: Scientific American Library; 1999. Evolving brains.
Publication types
MeSH terms
LinkOut - more resources
Full Text Sources
Medical
Molecular Biology Databases

