

High-throughput characterization of intrinsic disorder in proteins from the Protein Structure Initiative
- PMID: 22651963
- PMCID: PMC3578346
- DOI: 10.1016/j.jsb.2012.05.013
High-throughput characterization of intrinsic disorder in proteins from the Protein Structure Initiative
Abstract
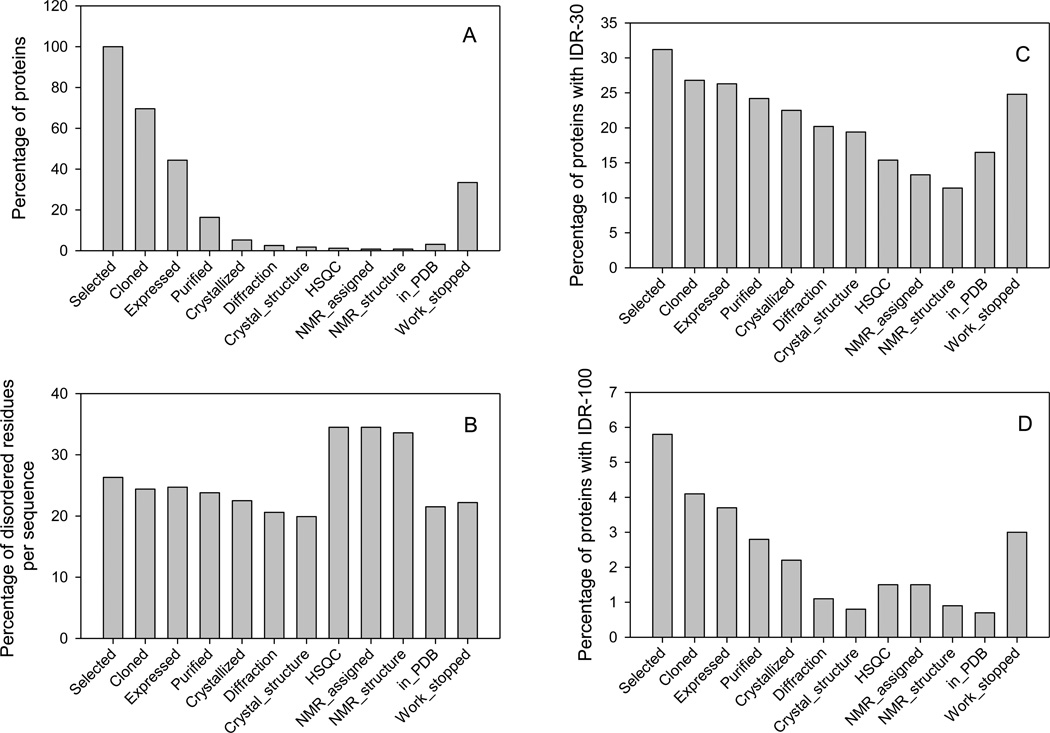
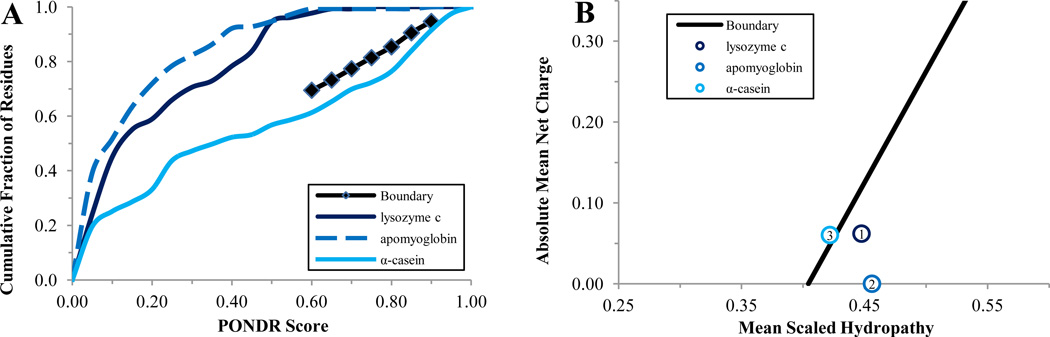
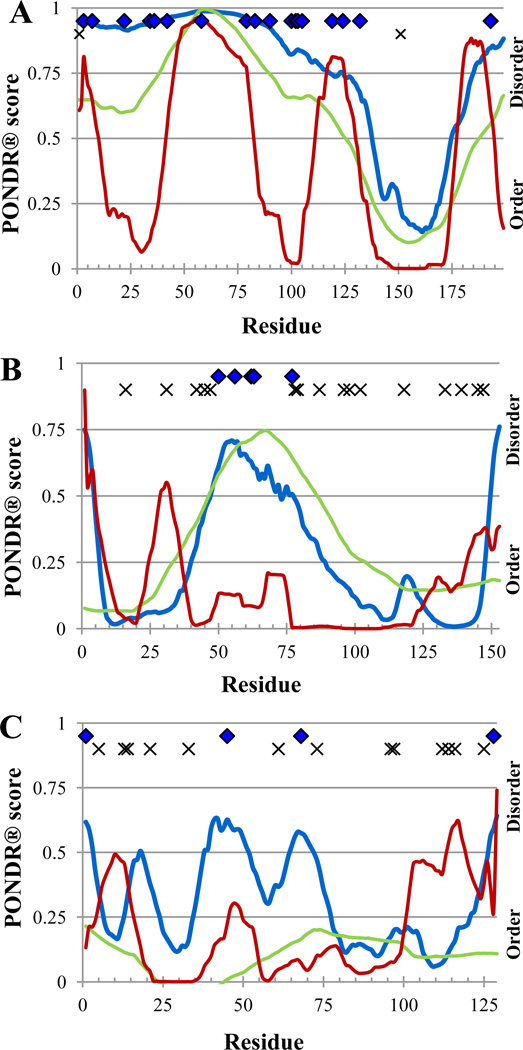
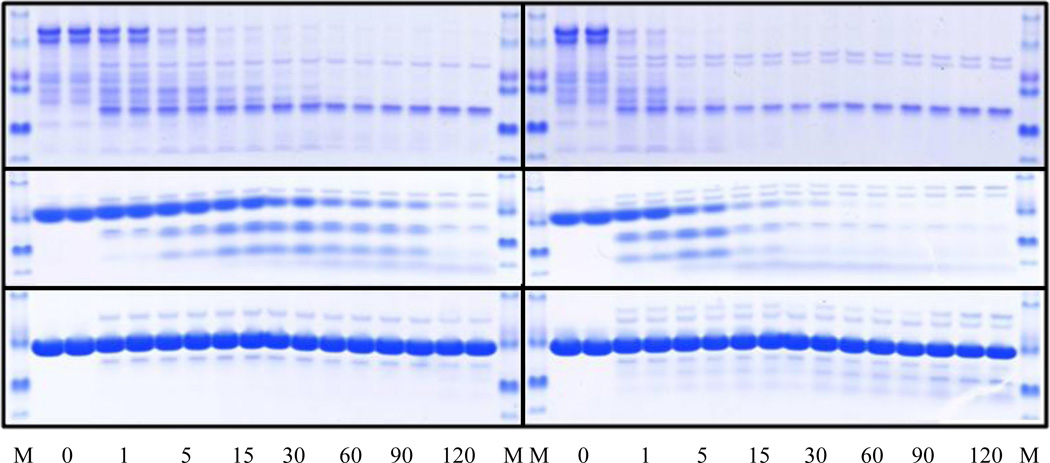
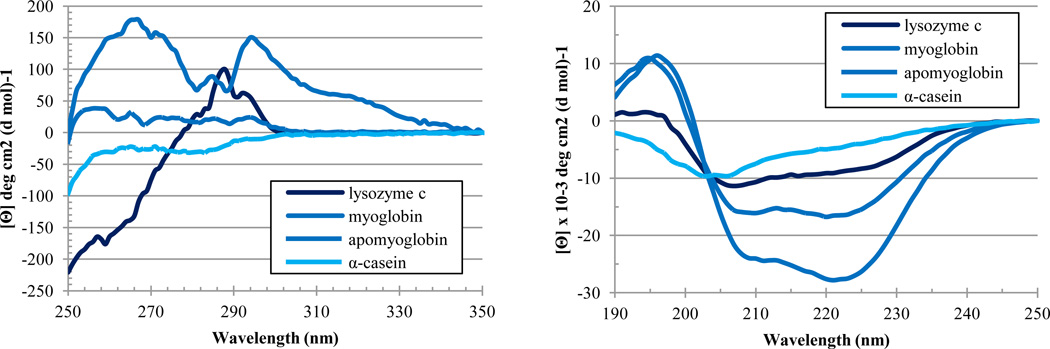
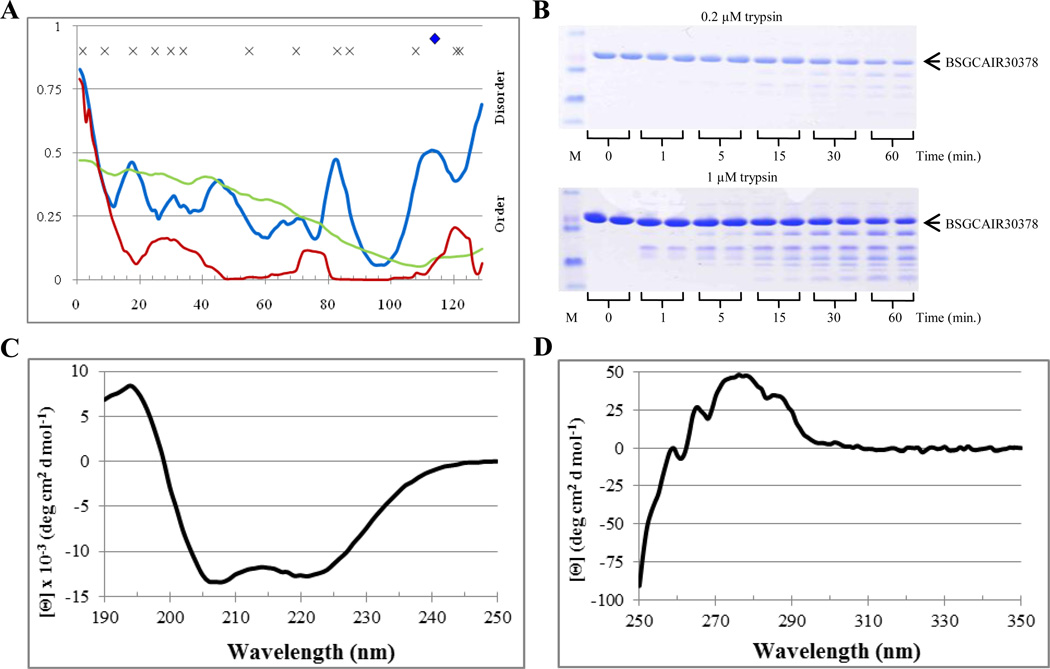
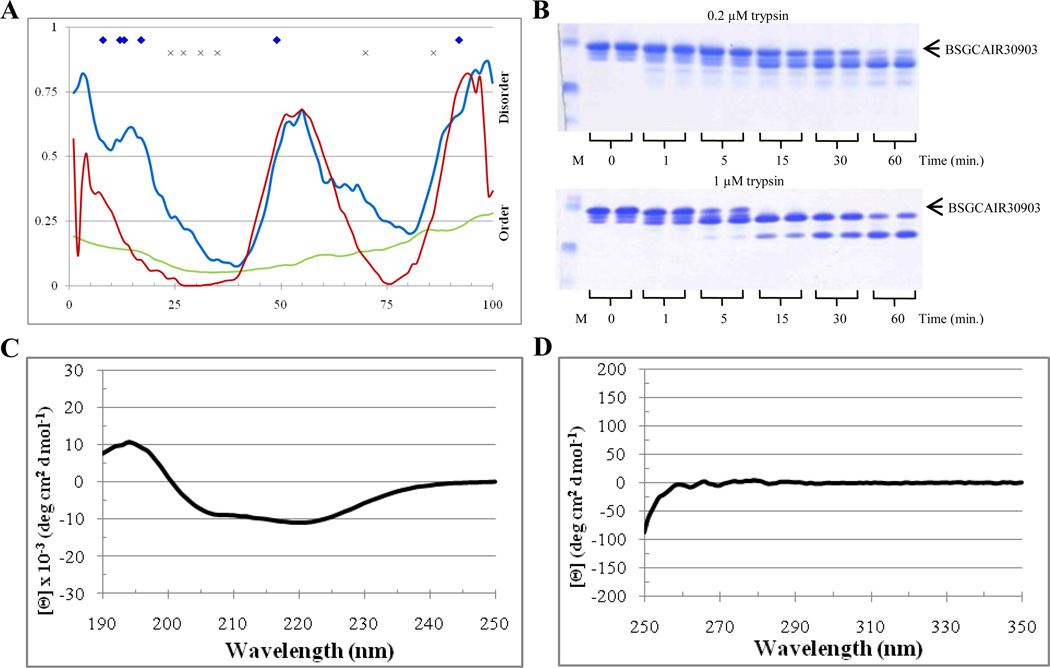
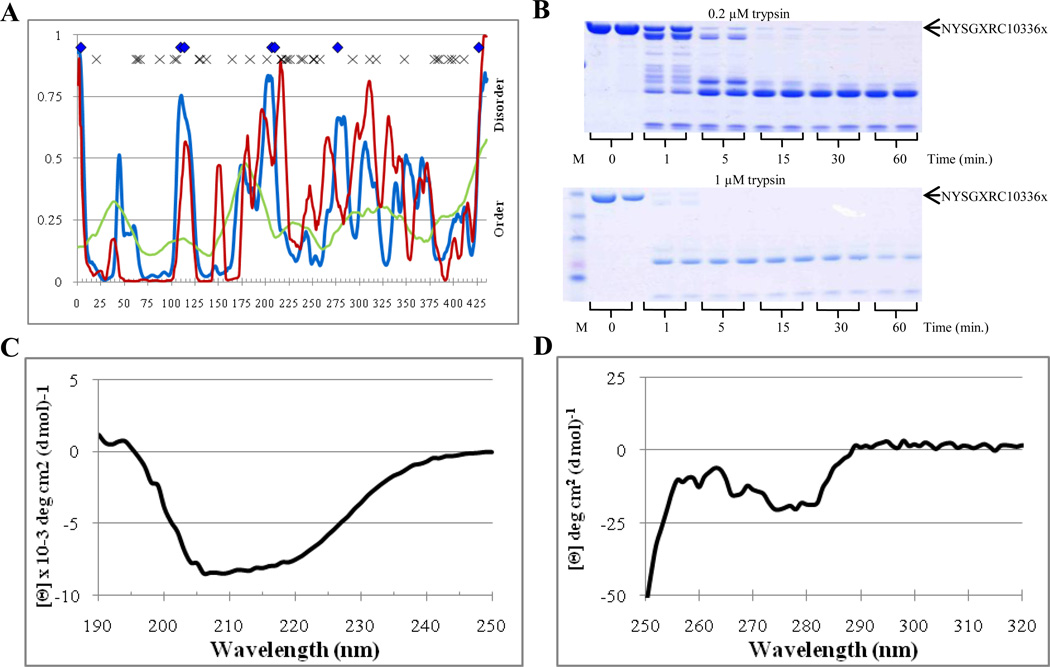
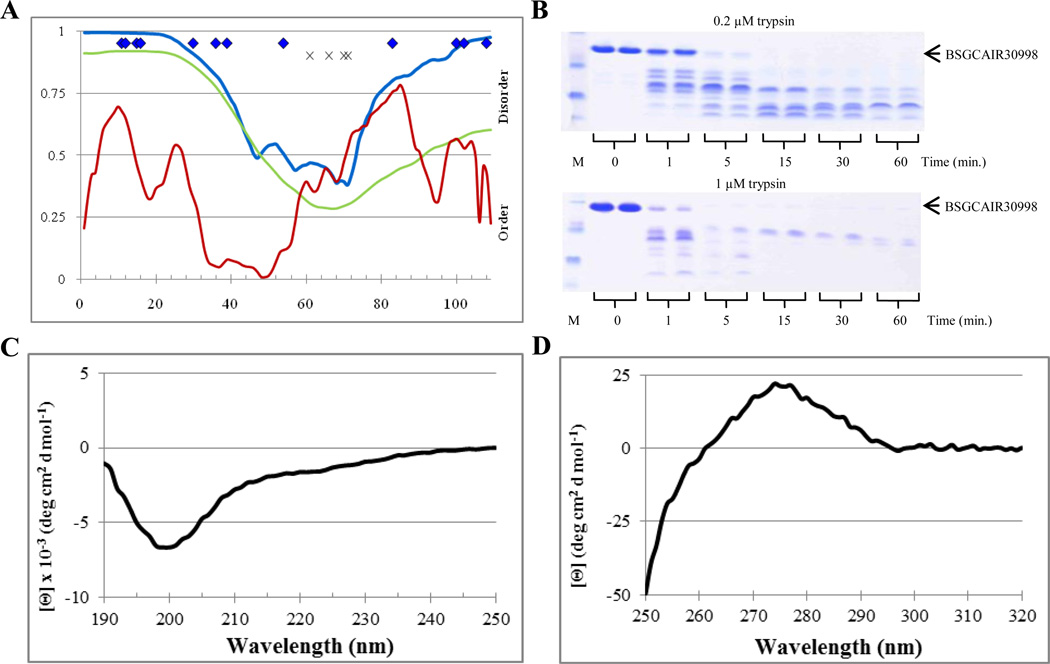
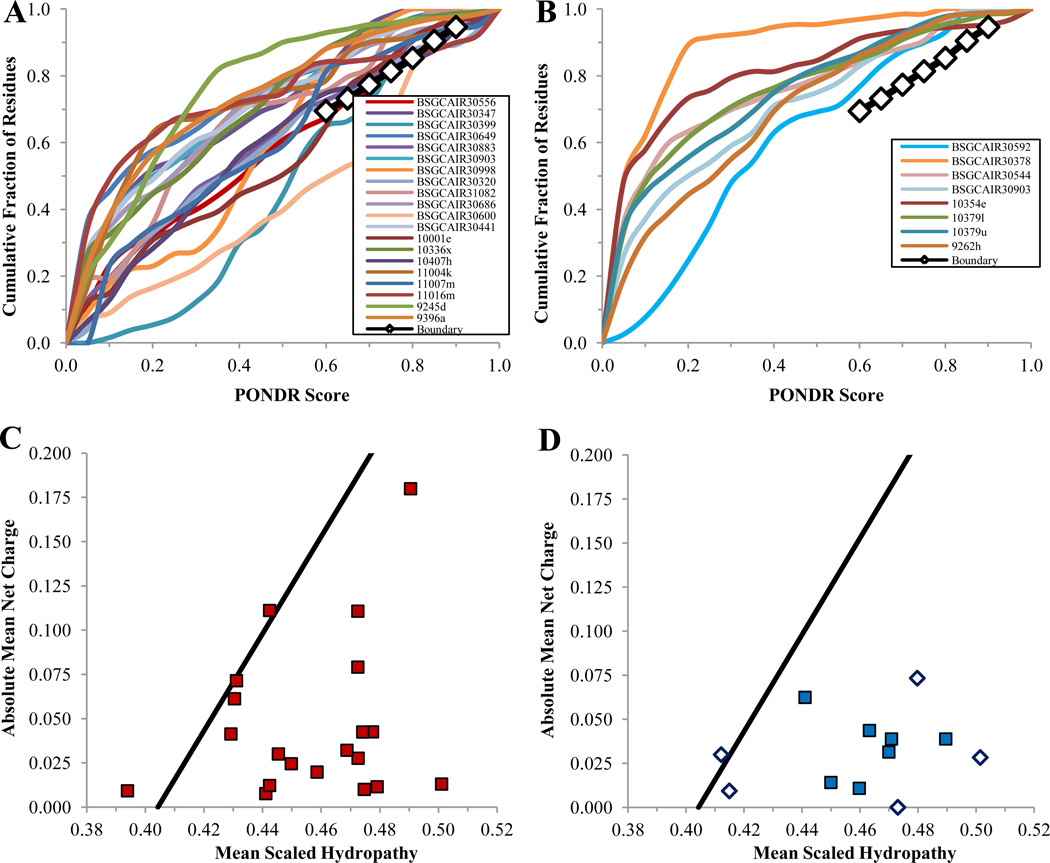
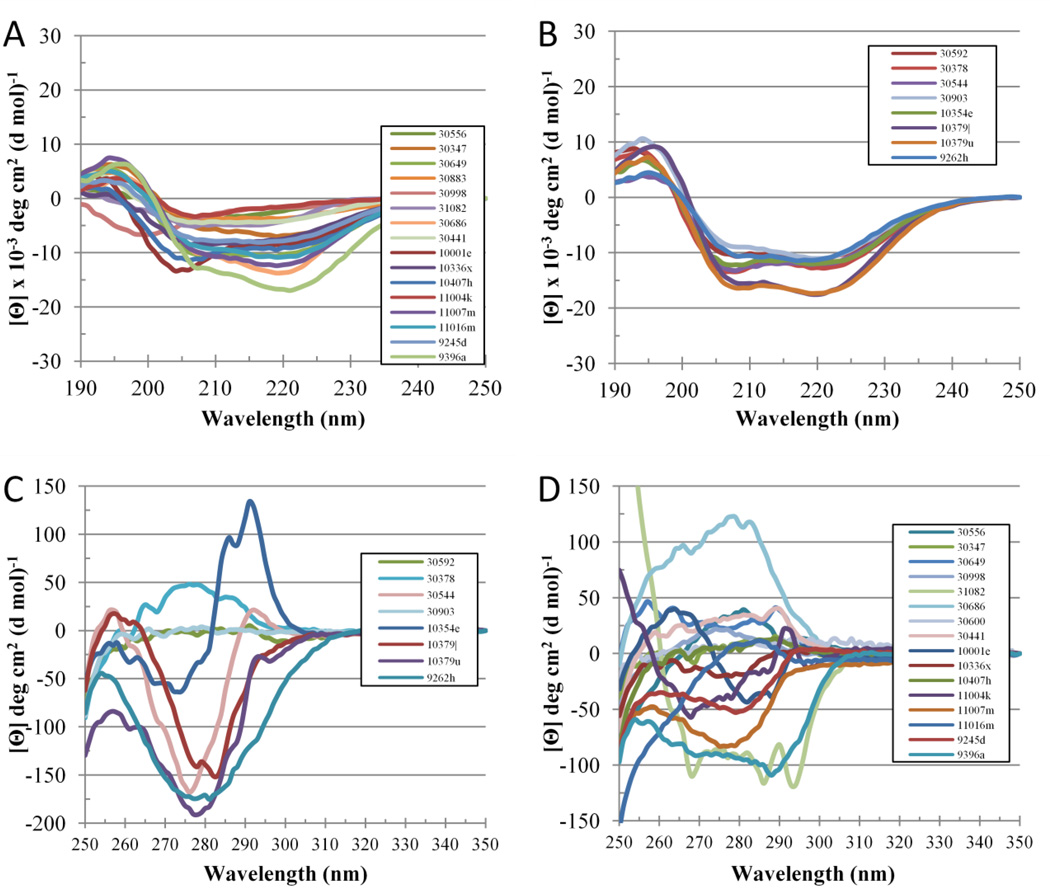
The identification of intrinsically disordered proteins (IDPs) among the targets that fail to form satisfactory crystal structures in the Protein Structure Initiative represents a key to reducing the costs and time for determining three-dimensional structures of proteins. To help in this endeavor, several Protein Structure Initiative Centers were asked to send samples of both crystallizable proteins and proteins that failed to crystallize. The abundance of intrinsic disorder in these proteins was evaluated via computational analysis using predictors of natural disordered regions (PONDR®) and the potential cleavage sites and corresponding fragments were determined. Then, the target proteins were analyzed for intrinsic disorder by their resistance to limited proteolysis. The rates of tryptic digestion of sample target proteins were compared to those of lysozyme/myoglobin, apomyoglobin, and α-casein as standards of ordered, partially disordered and completely disordered proteins, respectively. At the next stage, the protein samples were subjected to both far-UV and near-UV circular dichroism (CD) analysis. For most of the samples, a good agreement between CD data, predictions of disorder and the rates of limited tryptic digestion was established. Further experimentation is being performed on a smaller subset of these samples in order to obtain more detailed information on the ordered/disordered nature of the proteins.
Copyright © 2012 Elsevier Inc. All rights reserved.
Figures
Similar articles
-
Utilization of protein intrinsic disorder knowledge in structural proteomics.Biochim Biophys Acta. 2013 Feb;1834(2):487-98. doi: 10.1016/j.bbapap.2012.12.003. Epub 2012 Dec 8. Biochim Biophys Acta. 2013. PMID: 23232152 Free PMC article.
-
Intrinsic disorder in the Protein Data Bank.J Biomol Struct Dyn. 2007 Feb;24(4):325-42. doi: 10.1080/07391102.2007.10507123. J Biomol Struct Dyn. 2007. PMID: 17206849
-
Abundance of intrinsic disorder in protein associated with cardiovascular disease.Biochemistry. 2006 Sep 5;45(35):10448-60. doi: 10.1021/bi060981d. Biochemistry. 2006. PMID: 16939197
-
Intrinsically disordered proteins and intrinsically disordered protein regions.Annu Rev Biochem. 2014;83:553-84. doi: 10.1146/annurev-biochem-072711-164947. Epub 2014 Mar 5. Annu Rev Biochem. 2014. PMID: 24606139 Review.
-
Bioinformatical approaches to characterize intrinsically disordered/unstructured proteins.Brief Bioinform. 2010 Mar;11(2):225-43. doi: 10.1093/bib/bbp061. Epub 2009 Dec 10. Brief Bioinform. 2010. PMID: 20007729 Review.
Cited by
-
TFG clusters COPII-coated transport carriers and promotes early secretory pathway organization.EMBO J. 2015 Mar 12;34(6):811-27. doi: 10.15252/embj.201489032. Epub 2015 Jan 13. EMBO J. 2015. PMID: 25586378 Free PMC article.
-
Mutations in membrane-fusion subunit of spike glycoprotein play crucial role in the recent outbreak of COVID-19.J Med Virol. 2021 May;93(5):2790-2798. doi: 10.1002/jmv.26598. Epub 2021 Feb 23. J Med Virol. 2021. PMID: 33090493 Free PMC article.
-
Paradoxes and wonders of intrinsic disorder: Stability of instability.Intrinsically Disord Proteins. 2017 Oct 16;5(1):e1327757. doi: 10.1080/21690707.2017.1327757. eCollection 2017. Intrinsically Disord Proteins. 2017. PMID: 30250771 Free PMC article.
-
A Disorder-to-Order Transition Mediates RNA Binding of the Caenorhabditis elegans Protein MEX-5.Biophys J. 2020 Apr 21;118(8):2001-2014. doi: 10.1016/j.bpj.2020.02.032. Epub 2020 Mar 19. Biophys J. 2020. PMID: 32294479 Free PMC article.
-
Illuminating Intrinsically Disordered Proteins with Integrative Structural Biology.Biomolecules. 2023 Jan 7;13(1):124. doi: 10.3390/biom13010124. Biomolecules. 2023. PMID: 36671509 Free PMC article. Review.
References
-
- Bode W, Huber R. Natural protein proteinase inhibitors and their interaction with proteinases. Eur. J. Biochem. 1992;204:433–451. - PubMed
-
- Brenner SE. Target selection for structural genomics. Nat Struct Biol. 2000;7(Suppl):967–969. - PubMed
-
- Burley SK, Bonanno JB. Structural genomics of proteins from conserved biochemical pathways and processes. Curr Opin Struct Biol. 2002;12:383–391. - PubMed
-
- Chen L, Oughtred R, Berman HM, Westbrook J. TargetDB: a target registration database for structural genomics projects. Bioinformatics. 2004;20:2860–2862. - PubMed
Publication types
MeSH terms
Substances
Grants and funding
LinkOut - more resources
Full Text Sources
