. 2012 Oct;123(1):60-72.
doi: 10.1111/j.1471-4159.2012.07814.x. Epub 2012 Aug 14.

Calcyon, a mammalian specific NEEP21 family member, interacts with adaptor protein complex 3 (AP-3) and regulates targeting of AP-3 cargoes

Affiliations

Calcyon, a mammalian specific NEEP21 family member, interacts with adaptor protein complex 3 (AP-3) and regulates targeting of AP-3 cargoes

Nagendran Muthusamy et al. J Neurochem. 2012 Oct.

Abstract

Calcyon is a neural enriched, single transmembrane protein that interacts with clathrin light chain and stimulates clathrin assembly and clathrin-mediated endocytosis. A similar property is shared by the heterotetrameric adaptor protein (AP) complexes AP-1, AP-2, and AP-3 which recruit cargoes for insertion into clathrin coated transport vesicles. Here we report that AP medium (μ) subunits interact with a YXXØ-type tyrosine motif located at residues 133-136 in the cytoplasmic domain of calcyon. Site specific mutagenesis of the critical tyrosine and bulky hydrophobic residues tyrosine 133 and methionine 136 preferentially abrogated binding of the ubiquitous and neuronal isoforms of μ3, and also impacted μ1 and μ2 binding to a lesser degree. The relevance of these interactions was explored in vivo using mice harboring null alleles of calcyon. As seen in the mutagenesis studies, calcyon deletion in mice preferentially altered the subcellular distribution of AP-3 suggesting that calcyon could regulate membrane-bound pools of AP-3 and AP-3 function. To test this hypothesis, we focused on the hilar region of hippocampus, where levels of calcyon, AP-3, and AP-3 cargoes are abundant. We analyzed brain cryosections from control and calcyon null mice for zinc transporter 3 (ZnT3), and phosphatidylinositol-4-kinase type II alpha (PI4KIIα), two well-defined AP-3 cargoes. Confocal microscopy indicated that ZnT3 and PI4KIIα are significantly reduced in the hippocampal mossy fibers of calcyon knock-out brain, a phenotype previously described in AP-3 deficiencies. Altogether, our data suggest that calcyon directly interacts with μ3A and μ3B, and regulates the subcellular distribution of AP-3 and the targeting of AP-3 cargoes.


Figures

Figure 1
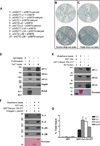
Figure 1. Calcyon directly interacts with ‘µ’ subunits of adaptor proteins
A. Y2H bait and prey plasmid pairs tested. Plasmid pairs were transformed into HF7C cells, and plated in sectors labeled ‘one’ to ‘ten’ on the double (−Leu, −Trp, +His) and triple (−Leu, −Trp, −His) dropout plates shown in B and C, respectively. Growth of colonies co-transfected with pGBT9 calcyon (104–217) and pGADT7-µ1, pACT2-µ2, pGADT7-µ3A or pACT2-µ3B suggests prototrophy on histidine deficient media depends on AP interaction with calcyon. D. Immunoblots of proteins eluted following incubation of CalOE brain extracts with anti-FLAG or non-immune IgG beads as indicated by the plus and minus signs. Blots were probed with antibodies to γ, α, and δ subunits of AP-1, AP-2, and AP-3, respectively as well as with Hsp90 and FLAG antibodies. E. Immunoblots of proteins eluted after incubation of control mouse brain S2 fractions with GST or GST-calcyon 104–217 bound to glutathione resin. Blots were probed with antibodies to the γ, α, and δ AP subunits as in D. F. S-HRP detection of AP µ subunits eluted following incubation of resin bound GST or GST-calcyon 104–217 with purified S-tagged µ1, µ2, µ3A and µ3B subunits as indicated to the right of each panel. Ponceau S staining of the lower molecular weight region of the blots in E and F confirms that equivalent amounts of GST and GST-Calcyon 104–217 were used. G. Histogram showing the mean AP µ subunit binding to GST and GST-Calcyon 104–217 detected in three independent experiments expressed as a fraction of input. Error bars indicate the standard error of the mean (SEM).
Figure 2
Figure 2. Second 'YXXØ' motif in the calcyon C-terminus is necessary for AP interaction
A. Diagram of GST-calcyon C terminus tyrosine point mutations (shown in red) tested. B. Immunoblots of proteins eluted following incubation of purified S-µ1, S-µ2, S-µ3A and S-µ3B subunit (shown to the right) with the GST-Cal fusion proteins, or GST only as indicated by the plus and minus signs. C. Densitometric analysis of the immunoblots from two independent experiments suggests that the second YXXØ motif of calcyon is necessary for interaction with APs. Bars and error bars in the histogram reflect the mean and SEM. Middle section of confocal z-stack images of Cos-7 cells transfected with (D) mCherry-Calcyon WT and (E) mCherry-Calcyon- A133TEA136. The intensity of the mCherry protein fluorescence is displayed using a HeatMap lookup table (bar = 10 mm).
Figure 3
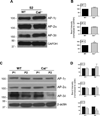
Figure 3. Reduced levels of membrane associated AP-3 in Cal−/− brain
A. Synaptic vesicle containing high-speed supernatants (S2) of WT and Cal−/− brains were separated by SDS PAGE and probed with antibodies to the γ, α, and δ subunits of AP-1, AP-2, and AP-3, respectively, as indicated, as well as with antibodies to GAPDH as a loading control. B. Histogram shows the mean AP levels and error bars indicate SEM detected in the WT (black bars) and Cal−/− brain (grey bars) S2 fractions when normalized to GAPDH levels. AP-3δ is elevated in the Cal−/− S2 fractions compared to levels detected in WT samples (*, p< 0.05). C. P1 and P2 membrane fractions of wild type (WT) and Cal−/− brains were separated by SDS PAGE and probed with antibodies to the γ, α, and δ subunits of AP-1, AP-2, and AP-3, respectively, as indicated, as well as with antibodies to β-actin. Positions of the molecular weight markers are shown to the left. D. Bar graph shows the mean AP levels and error bars the SEM detected in the WT (black bars) and Cal−/− (grey bars) samples following normalization to β-actin levels. Cal−/− values are expressed as percent of WT levels. AP-3δ is reduced in the Cal−/− P2 fractions compared to levels detected in WT samples (**, p< 0.01, two-way ANOVA followed by Bonferroni post-test).
Figure 4
Figure 4. Altered targeting of AP-1 and AP-3 in Cal−/− brain
A. AP levels across the glycerol gradient fractions were determined by re-probing the blots in Fig. S3 with antibodies to the γ, α, and δ subunits of AP-1, AP-2, and AP-3, respectively as well as with β-actin antibodies. B. Sedimentation profile of each protein across the gradient following normalization to the total present in the wild type (WT) sample. Closed and open circles show the mean and error bars, the SEM (n=3) of levels in the WT and Cal−/− fractions, respectively. AP1- γ and AP3- δ levels are increased in the non-SV2 containing fractions (*, ** and***, p<0.05, 0.01, and 0.001, respectively, two-way ANOVA followed by Bonferroni post-tests).
Figure 5
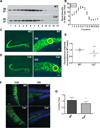
Figure 5. Calcyon regulates trafficking of ZnT3 to mossy fibers
A. Sedimentation profile of ZnT3 in glycerol gradient fractions prepared from wild type (WT) and Cal−/− brains determined by immunoblotting with ZnT3 antibodies. B. Distribution of ZnT3 across the WT (closed circles) and Cal−/− (open circles) gradients following normalization to the total present in the WT gradients. Positions of molecular weight markers are shown to the left. C, D. ZnT3 immunostaining of hippocampal cryosections from WT (C) and Cal−/− (D) mice at low (left) and high (right) magnification. E. Fluorescent staining intensities were obtained in circles (shown in yellow) of equal area positioned over the hilus. Values of ZnT3 staining in Cal−/− samples were normalized to those detected in WT samples in the same rostral-caudal position. Scatter plot shows values for each sample and horizontal line, the SEM. Compared to levels detected in WT, ZnT3 levels in the hilus of the dentate gyrus are significantly reduced in Cal−/− brain (**, p<0.01, t-test). F. Higher magnification (40×) view of ZnT3 staining (green) in mossy fiber terminals in CA3 region (left), and axons in the hilus of the dentate gyrus (right). Nuclei were detected with DAPI (blue). The axon to terminal staining ratio for each sample was determined following measurement of ZnT3 labeling in the hilus and CA3 area using circles of equal size as described above. Bar= 50 µM. G. Histogram with bars and error bars showing the mean CA3/Hilus ratio, and the SEM for the WT and Cal−/− samples. The ratio is significantly reduced in Cal−/− samples suggesting impaired sorting of ZnT3 to terminals in the CA3 (*, p<0.05 two-tailed paired t-test).
Figure 6
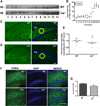
Figure 6. Calcyon regulates expression of PI4KIIα in the hilus of the dentate gyrus
A. Sedimentation profile of PI4KIIα in glycerol gradient fractions prepared from wild type (WT) and Cal−/− brains determined by immunoblotting. B. Distribution of PI4KIIα across the WT (closed circles) and Cal−/− (open circles) gradients following normalization to the total present in the WT samples. Molecular weight markers are shown to the left. C, D. PI4KIIα immunostaining in WT (C),, and Cal−/− (D) hippocampus at low (left) and high (right) magnification. Fluorescent staining intensities were obtained in circles (such as shown in yellow) of equal area positioned over the hilus. Staining in Cal−/− samples was normalized to that detected in WT samples in the same rostral-caudal location. E. Scatter plot showing values for each sample with horizontal line indicating the SEM. Compared to levels detected in WT, PI4KIIα levels in the hilus of the Cal−/− dentate gyrus are significantly reduced (*, p<0.05, t-test). F. Higher magnification (40×) view of PI4KIIα staining of granule cells (green). Nuclei were detected with DAPI (blue). The axon/cell body staining ratio for each sample was determined following measurement of PI4KIIα labeling in the cell body area and adjacent mossy fibers using circles of equal area as described above. Bar= 100 µM G. Histogram with bars and error bars showing the mean axon/soma ratio, and the SEM for the WT and Cal−/− samples (*, p<0.05, t-test). The ratio is significantly reduced in Cal−/− samples indicating impaired sorting of PI4KIIα to axons.

Similar articles

Cited by

References

    1. Acsády L, Kamondi A, Sík A, Freund T, Buzsáki G. GABAergic cells are the major postsynaptic targets of mossy fibers in the rat hippocampus. J. Neurosci. 1998;18:3386–3403. - PMC - PubMed
    1. Ali MK, Bergson C. Elevated intracellular calcium triggers recruitment of the receptor cross-talk accessory protein calcyon to the plasma membrane. J.Biol.Chem. 2003;278:51654–51663. - PubMed
    1. Baust T, Anitei M, Czupalla C, Parshyna I, Bourel L, Thiele C, Krause E, Hoflack B. Protein networks supporting AP-3 function in targeting lysosomal membrane proteins. Mol. Biol. Cell. 2008;19:1942–1951. - PMC - PubMed
    1. Bonifacino JS, Traub LM. Signals for sorting of transmembrane proteins to endosomes and lysosomes. Annu. Rev. Biochem. 2003;72:395–447. - PubMed
    1. Chicurel ME, Harris KM. Three-dimensional analysis of the structure and composition of CA3 branched dendritic spines and their synaptic relationships with mossy fiber boutons in the rat hippocampus. J. Comp. Neurol. 1992;325:169–182. - PubMed

Publication types

MeSH terms