

The diffusion tensor imaging toolbox
- PMID: 22649222
- PMCID: PMC3444512
- DOI: 10.1523/JNEUROSCI.4687-11.2012
The diffusion tensor imaging toolbox
Abstract
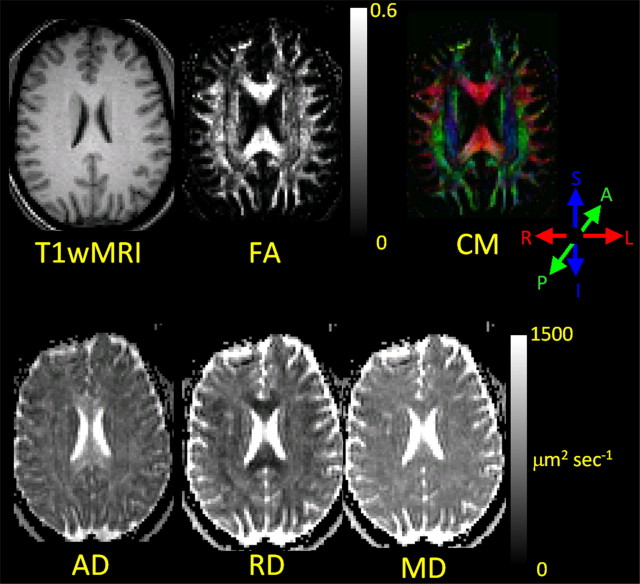
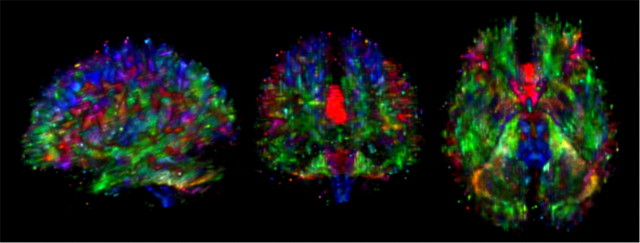
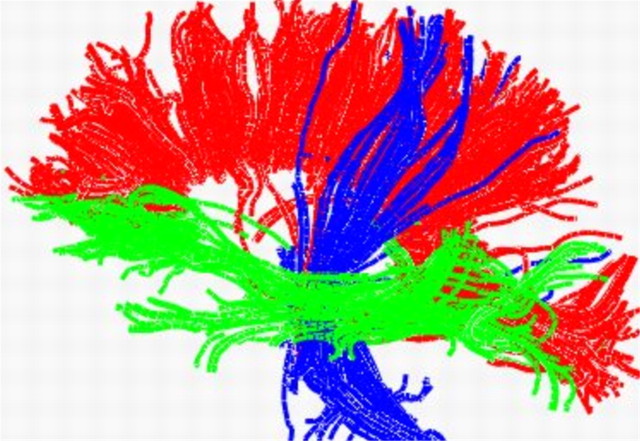
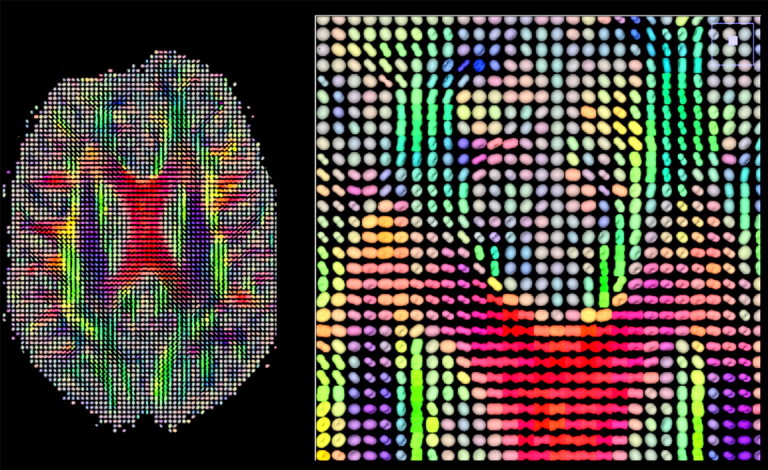
During the past few years, The Journal of Neuroscience has published more than 30 articles that describe investigations that used Diffusion Tensor Imaging (DTI) and related techniques as a primary observation method. This illustrates a growing interest in DTI within the basic and clinical neuroscience communities. This article summarizes DTI methodology in terms that can be immediately understood by the neuroscientist who has little previous exposure to DTI. It describes the fundamentals of water molecular diffusion coefficient measurement in brain tissue and illustrates how these fundamentals can be used to form vivid and useful depictions of white matter macroscopic and microscopic anatomy. It also describes current research applications and the technique's attributes and limitations. It is hoped that this article will help the readers of this Journal to more effectively evaluate neuroscience studies that use DTI.
Figures
Similar articles
-
Diffusion tensor imaging (DTI)-based white matter mapping in brain research: a review.J Mol Neurosci. 2008;34(1):51-61. doi: 10.1007/s12031-007-0029-0. J Mol Neurosci. 2008. PMID: 18157658 Review.
-
New insights into the developing rabbit brain using diffusion tensor tractography and generalized q-sampling MRI.PLoS One. 2015 Mar 23;10(3):e0119932. doi: 10.1371/journal.pone.0119932. eCollection 2015. PLoS One. 2015. PMID: 25798595 Free PMC article.
-
Bound pool fractions complement diffusion measures to describe white matter micro and macrostructure.Neuroimage. 2011 Jan 15;54(2):1112-21. doi: 10.1016/j.neuroimage.2010.08.068. Epub 2010 Sep 7. Neuroimage. 2011. PMID: 20828622 Free PMC article.
-
Construction of a stereotaxic DTI atlas with full diffusion tensor information for studying white matter maturation from childhood to adolescence using tractography-based segmentations.Hum Brain Mapp. 2010 Mar;31(3):470-86. doi: 10.1002/hbm.20880. Hum Brain Mapp. 2010. PMID: 19957267 Free PMC article.
-
Diffusion tensor imaging: a review for pediatric researchers and clinicians.J Dev Behav Pediatr. 2010 May;31(4):346-56. doi: 10.1097/DBP.0b013e3181dcaa8b. J Dev Behav Pediatr. 2010. PMID: 20453582 Free PMC article. Review.
Cited by
-
Microstructural white-matter abnormalities and their relationship with cognitive dysfunction in obsessive-compulsive disorder.Brain Behav. 2016 Feb 5;6(3):e00442. doi: 10.1002/brb3.442. eCollection 2016 Mar. Brain Behav. 2016. PMID: 27099803 Free PMC article.
-
Diffusion tensor imaging in Alzheimer's disease: insights into the limbic-diencephalic network and methodological considerations.Front Aging Neurosci. 2014 Oct 2;6:266. doi: 10.3389/fnagi.2014.00266. eCollection 2014. Front Aging Neurosci. 2014. PMID: 25324775 Free PMC article. Review.
-
The detection of white matter alterations in obsessive-compulsive disorder revealed by TRActs Constrained by UnderLying Anatomy (TRACULA).Neuropsychiatr Dis Treat. 2018 Jun 19;14:1635-1643. doi: 10.2147/NDT.S164058. eCollection 2018. Neuropsychiatr Dis Treat. 2018. PMID: 29950845 Free PMC article.
-
Interaction of amyloid and tau on cortical microstructure in cognitively unimpaired adults.Alzheimers Dement. 2022 Jan;18(1):65-76. doi: 10.1002/alz.12364. Epub 2021 May 13. Alzheimers Dement. 2022. PMID: 33984184 Free PMC article.
-
Phantom-based field maps for gradient nonlinearity correction in diffusion imaging.Proc SPIE Int Soc Opt Eng. 2018 Mar;10573:105733N. doi: 10.1117/12.2293786. Proc SPIE Int Soc Opt Eng. 2018. PMID: 29887658 Free PMC article.
References
-
- Alexander DC. Multiple-fiber reconstruction algorithms for diffusion MRI. Ann N Y Acad Sci. 2005;1064:113–133. - PubMed
-
- Anderson AW. Measurement of fiber orientation distributions using high angular resolution diffusion imaging. Magn Reson Med. 2005;54:1194–1206. - PubMed
-
- Baratti C, Barnett AS, Pierpaoli C. Comparative MR imaging study of brain maturation in kittens with T1, T2, and the trace of the diffusion tensor. Radiology. 1999;210:133–142. - PubMed
-
- Basser PJ, Pierpaoli C. Microstructural and physiological features of tissues elucidated by quantitative-diffusion-tensor MRI. J Magn Reson B. 1996;111:209–219. - PubMed
Publication types
MeSH terms
Substances
Grants and funding
- R01 HD061504/HD/NICHD NIH HHS/United States
- DK082370/DK/NIDDK NIH HHS/United States
- U01 DK082370/DK/NIDDK NIH HHS/United States
- P50 NS044378/NS/NINDS NIH HHS/United States
- MH081864/MH/NIMH NIH HHS/United States
- RC1 MH088507/MH/NIMH NIH HHS/United States
- R01 EB000822/EB/NIBIB NIH HHS/United States
- R01 MH081864/MH/NIMH NIH HHS/United States
- NS044378/NS/NINDS NIH HHS/United States
- NS060675/NS/NINDS NIH HHS/United States
- MH088507/MH/NIMH NIH HHS/United States
- EB00822/EB/NIBIB NIH HHS/United States
- R21 NS060675/NS/NINDS NIH HHS/United States
LinkOut - more resources
Full Text Sources
Miscellaneous