. 2011 Nov;1(3):110007.
doi: 10.1098/rsob.110007.

The reverse, but coordinated, roles of Tor2 (TORC1) and Tor1 (TORC2) kinases for growth, cell cycle and separase-mediated mitosis in Schizosaccharomyces pombe

Affiliations

The reverse, but coordinated, roles of Tor2 (TORC1) and Tor1 (TORC2) kinases for growth, cell cycle and separase-mediated mitosis in Schizosaccharomyces pombe

Nobuyasu Ikai et al. Open Biol. 2011 Nov.

Abstract

Target of rapamycin complexes (TORCs), which are vital for nutrient utilization, contain a catalytic subunit with the phosphatidyl inositol kinase-related kinase (PIKK) motif. TORC1 is required for cell growth, while the functions of TORC2 are less well understood. We show here that the fission yeast Schizosaccharomyces pombe TORC2 has a cell cycle role through determining the proper timing of Cdc2 Tyr15 dephosphorylation and the cell size under limited glucose, whereas TORC1 restrains mitosis and opposes securin-separase, which are essential for chromosome segregation. These results were obtained using the previously isolated TORC1 mutant tor2-L2048S in the phosphatidyl inositol kinase (PIK) domain and a new TORC2 mutant tor1-L2045D, which harbours a mutation in the same site. While mutated TORC1 and TORC2 displayed diminished kinase activity and FKBP12/Fkh1-dependent rapamycin sensitivity, their phenotypes were nearly opposite in mitosis. Premature mitosis and the G2-M delay occurred in TORC1 and TORC2 mutants, respectively. Surprisingly, separase/cut1-securin/cut2 mutants were rescued by TORC1/tor2-L2048S mutation or rapamycin addition or even Fkh1 deletion, whereas these mutants showed synthetic defect with TORC2/tor1-L2045D. TORC1 and TORC2 coordinate growth, mitosis and cell size control, such as Wee1 and Cdc25 do for the entry into mitosis.

Keywords: target of rapamycin, rapamycin, Fkh1, Cdc2, separase.


Figures
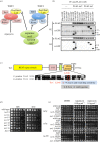
Figure 1.
Figure 1.
Schizosaccharomyces pombe TORC1 and TORC2 and construction of tor1-D mutant. (a) Schematic diagram of the subunit compositions previously determined by mass spectrometry [23]. The ts mutant tor2-S is highly sensitive to rapamycin. Multi-copy plasmid pCUT1 carrying the separase gene is inhibitory when introduced in ste20-545, 589 and pop3/wat1-803 mutants [33] (Ste20 and Pop3/Wat1 are Rictor and Lst8 homologues, respectively). (b) Immunoprecipitation (IP) with anti-FLAG antibodies was performed for 15 strains that contained FLAG-tagged Tor2 or Tor1, and one of five GFP-tagged regulatory subunits (see text). A non-tagged strain (−) was used as negative control. Top: vegetatively (VE) growing cells were collected and immunoprecipitated by anti-FLAG antibodies. The resulting precipitates were run on SDS-PAGE and immunoblotted using anti-GFP antibodies. Bottom: the same experiment was performed, except that the cells were from the G0 phase. (c) Conserved amino acid sequences of S. pombe Tor2 and Tor1 PI3K domains are shown. L2048 of Tor2 corresponds to L2045 of Tor1. Five substitution (S, P, N, G and D) mutants at the L2045 residue were made. (d) Only the L2045D substitution produced the ts phenotype for tor1 at 36°C, which is designated tor1-D. For controls, tor2-L2048S (previously constructed and designated tor2-S in the present study) and deletion Δtor1 are shown (see text). (e) The rapamycin sensitivity of tor2-S and tor1-D was examined in the presence of the deletion (Δ) of Fkh1 at various temperatures. See text.
Figure 2.
Figure 2.
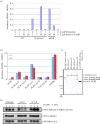
Diminished activities of mutant TORC1 and TORC2 and their cross talk interaction. (a) The kinase assay kit (K-LISA mTOR, Merck) was used with the human recombinant p70S6K-GST fusion protein as the substrate. The reaction mixture was incubated at 30°C, and the degree of phosphorylated S6KT389 was assayed by ELISA method. IP was conducted for the two strains, non-tagged 972 and chromosomally integrated FLAG-tagged tor2+. Immunoprecipitates from FLAG-tor2+ contained the dosage-dependent and Wortmannin-sensitive kinase activity, similar to mTOR. Extract 5 µl was equivalent to the IP obtained from 7 × 10⁸ cells. See text. (b) FLAG-tagged tor1+, tor2+, mutants tor1-D and tor2-S were employed for IP, and the TOR kinase activities of IP were measured. A positive control (mTOR) and negative controls (non-tagged and Cut14-FLAG) were also used. (c) Protein levels in the immunoprecipitates of FLAG-tagged proteins were assayed by immunoblot using anti-FLAG antibodies. The tagged strains used are all chromosomally integrated and expressed under the native promoters. (d) Immunoblot patterns of extracts of wild-type, tor2-S and tor1-D cultures grown at 26°C and then shifted to 36°C for 8 h. Antibodies against PAS (indicator of the TORC1 activity) and tubulin (TAT1) were used.
Figure 3.
Figure 3.
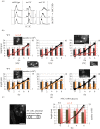
Phenotypic differences between tor1-D and tor2-S. (a) Wild-type, tor2-S and tor1-D initially grown at 26°C in YPD medium were shifted to 36°C for 0–8 h followed by measurement of DNA contents by FACScan. tor1-D shows the 2C peak that is shifted owing to the increase in cell length. (b) The cell length (micrometres, columns) and the cell number (line) of wild-type (black), tor1-D (red) and tor2-S (yellow) were measured for cells cultured initially at 26°C and then shifted to 30°C, 33°C and 37°C for 0–8 h. DAPI-stained cells taken at 8 h are also shown. (c) A small population of cells shows abnormally positioned septum. DAPI-stained tor1-D cells at 8 h. (d) Wild-type (tor1+) and tor1-D mutant were initially grown at 26°C in 2% glucose regular medium and then shifted to 34°C in low-glucose medium (0.08%). The cell number (line) and length (column, micrometre) are shown for wild-type (black) and tor1-D (red). (b,c) Scale bars, 10 µm.
Figure 4.
Figure 4.
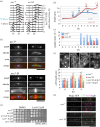
Mitotic delay and actin abnormality of tor1-D. (a–c) Wild-type (tor1+) and mutant tor1-D were brought into G0 phase by nitrogen starvation (EMM2-N) at 26°C for 24 h, and then released into nitrogen-replenished rich YPD medium at 37°C for 11 h. (a) The DNA content of cells after release from G0 was examined every 1 h by FACScan. S and M phase are indicated. (b) The cell length was measured after nitrogen replenishment at 37°C. Wild-type (blue line) and tor1-D (red line) are shown. (c) Immunofluorescence microscopy was performed to observe the mitotic spindle index using antibodies against tubulin (TAT1). (d) Micrographs of wild-type (tor1+) and mutant tor1-D cells stained by anti-tubulin, DNA-specific DAPI and actin-bound phalloidin. (e) The double mutant tor1-D Δclp1 was made, and cell length was compared with Δclp1 and tor1-D. See text. (f) Latrunculin A sensitivity was assayed for the single Δclp1 and the double mutant tor1-D Δclp1. (g) The myosin ring was visualized by the chomosomally integrated myp2-GFP in the wild-type (tor1+) and mutant tor1-D cells. (d,e,g) Scale bars, 10 µm.
Figure 5.
Figure 5.
Dephosphorylation of Cdc2 Tyr15 PO4 is delayed in tor1-D mutant cells. The wild-type (tor1+) and tor1-D mutant were first nitrogen-starved at 26°C for 24 h in the EMM2-N medium, and then shifted to the replenished rich YPD medium at 37°C. The experimental design is identical to that in figure 4ac. Aliquots of the culture media were taken at the 1 h intervals and extracts were run for immunoblot. Antibodies used were against Cdc2 (PSTAIR), Cdc2 (Tyr15PO4), Cdc13 (cyclin), Cut2 and PAS. The asterisk indicates the band position of phosphorylated Cdc2 at Tyr15. See text.
Figure 6.
Figure 6.
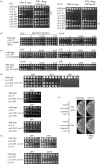
Rescue of ts cut1 and cut2 by rapamycin in the presence of Fkh1 or by tor2, and synthetic defects of tor1 and cut1 or cut2. (a) Rapamycin (0.005 µg ml−1) suppresses the ts phenotype of separase cut1 and securin cut2 mutants. Three cut1 alleles (-21, 693 and 206) and three cut2 alleles (-364, 447 and EA2) were spotted on YPD plates and incubated in the absence or presence of rapamycin at 26°C, 30°C, 33°C or 34.5°C for 3–4 days. Wild-type and rapamycin-sensitive tor2-S are shown as controls. Results obtained at 26°C and 30°C are shown in electronic supplementary material, figure S4. (b) Effect of rapamycin on cut1 mutants in the presence or absence of the Fkh1 gene. Δfkh1 is the deletion of Fkh1. (c) Effect of rapamycin on the cut2-447 mutant in the presence or absence of the Fkh1 gene. (d) Synthetic rescue of cut1 or cut2 mutant by tor2-S. Two cut1 and cut2 mutants were used to construct the double mutants with tor2-S. The ts phenotypes of the resulting double mutants were examined. (e) Additive ts phenotype of the double mutants between tor1-D and cut1-693 or cut2-364. (f) Synthetic inhibitory phenotype of plasmid pCUT1 and tor1-D mutant. See text.
Figure 7.
Figure 7.
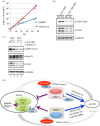
Securin and separase are scarce during rescue. (a) GFP was chromosomally tagged at the C-terminus of the cut1-206 mutant gene. The resulting strain cut1-206-GFP was cultured at 30°C in the presence (rapamycin) or absence (DMSO) of rapamycin (4 µg ml−1), and the cell number increase was measured. (b) The wild-type strain carrying the cut1+ gene was chromosomally tagged with GFP at the C-terminus. The protein levels of the resulting Cut1-GFP and mutant Cut1-206-GFP proteins were estimated in the presence (4 µg ml−1, Ra) or absence (Dm) of rapamycin at 26°C by immunoblot using anti-GFP antibodies. For comparison, the immunoblot of Cut2 and tubulin (loading control) were performed using polyclonal anti-Cut2 and monoclonal anti-TAT1 antibodies, respectively. (c) Lanes 1 and 2 show wild-type Cut1–GFP and mutant Cut1-206-GFP, respectively, grown in the absence of rapamycin at 26°C. Lanes 3 and 4 show mutant cut1-206-GFP cultured at 30°C in the presence or absence of rapamycin (4 µg ml−1), respectively. Immunoblot was performed to estimate the levels of the wild-type and mutant Cut1 (GFP). The levels of Rad21, Cut2 and tubulin were also estimated. The addition of rapamycin does not change the level of mutant Cut1-206-GFP. (d) A speculative explanation for the distinct mutant phenotypes of tor1-D and tor2-S for the control of mitosis and growth, and the cartoon describing the relationship between TOR complexes and securin–separase. See §4.

Similar articles

Cited by

References

    1. Schmelzle T, Hall MN. 2000. TOR, a central controller of cell growth. Cell 103, 253–26210.1016/S0092-8674(00)00117-3 (doi:10.1016/S0092-8674(00)00117-3) - DOI - DOI - PubMed
    1. Wullschleger S, Loewith R, Hall MN. 2006. TOR signaling in growth and metabolism. Cell 124, 471–48410.1016/j.cell.2006.01.016 (doi:10.1016/j.cell.2006.01.016) - DOI - DOI - PubMed
    1. Martel RR, Klicius J, Galet S. 1977. Inhibition of the immune response by rapamycin, a new antifungal antibiotic. Can. J. Physiol. Pharmacol. 55, 48–5110.1139/y77-007 (doi:10.1139/y77-007) - DOI - DOI - PubMed
    1. Sehgal SN, Baker H, Vezina C. 1975. Rapamycin (AY-22,989), a new antifungal antibiotic. II. Fermentation, isolation and characterization. J. Antibiotics 28, 727–732 - PubMed
    1. Zheng XF, Florentino D, Chen J, Crabtree GR, Schreiber SL. 1995. TOR kinase domains are required for two distinct functions, only one of which is inhibited by rapamycin. Cell 82, 121–13010.1016/0092-8674(95)90058-6 (doi:10.1016/0092-8674(95)90058-6) - DOI - DOI - PubMed

Publication types

MeSH terms

Substances