Inferring biological structures from super-resolution single molecule images using generative models
- PMID: 22629348
- PMCID: PMC3358321
- DOI: 10.1371/journal.pone.0036973
Inferring biological structures from super-resolution single molecule images using generative models
Abstract
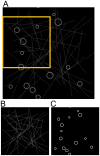
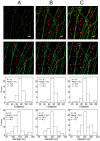
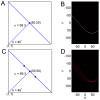
Localization-based super resolution imaging is presently limited by sampling requirements for dynamic measurements of biological structures. Generating an image requires serial acquisition of individual molecular positions at sufficient density to define a biological structure, increasing the acquisition time. Efficient analysis of biological structures from sparse localization data could substantially improve the dynamic imaging capabilities of these methods. Using a feature extraction technique called the Hough Transform simple biological structures are identified from both simulated and real localization data. We demonstrate that these generative models can efficiently infer biological structures in the data from far fewer localizations than are required for complete spatial sampling. Analysis at partial data densities revealed efficient recovery of clathrin vesicle size distributions and microtubule orientation angles with as little as 10% of the localization data. This approach significantly increases the temporal resolution for dynamic imaging and provides quantitatively useful biological information.
Conflict of interest statement
Figures


Similar articles
-
Image reconstructions from super-sampled data sets with resolution modeling in PET imaging.Med Phys. 2014 Dec;41(12):121912. doi: 10.1118/1.4901552. Med Phys. 2014. PMID: 25471972 Free PMC article.
-
A multi-emitter fitting algorithm for potential live cell super-resolution imaging over a wide range of molecular densities.J Microsc. 2018 Sep;271(3):266-281. doi: 10.1111/jmi.12714. Epub 2018 May 25. J Microsc. 2018. PMID: 29797718
-
Minimizing Structural Bias in Single-Molecule Super-Resolution Microscopy.Sci Rep. 2018 Sep 3;8(1):13133. doi: 10.1038/s41598-018-31366-w. Sci Rep. 2018. PMID: 30177692 Free PMC article.
-
Accurate construction of photoactivated localization microscopy (PALM) images for quantitative measurements.PLoS One. 2012;7(12):e51725. doi: 10.1371/journal.pone.0051725. Epub 2012 Dec 12. PLoS One. 2012. PMID: 23251611 Free PMC article.
-
Nanoscale Pattern Extraction from Relative Positions of Sparse 3D Localizations.Nano Lett. 2021 Feb 10;21(3):1213-1220. doi: 10.1021/acs.nanolett.0c03332. Epub 2020 Nov 30. Nano Lett. 2021. PMID: 33253583 Free PMC article.
Cited by
-
Fluorescence nanoscopy. Methods and applications.J Chem Biol. 2013 Jun 4;6(3):97-120. doi: 10.1007/s12154-013-0096-3. eCollection 2013 Jun 4. J Chem Biol. 2013. PMID: 24432127 Free PMC article. Review.
References
-
- Abbe E. Beitrage zur Theorie des Mikroskops und der mikroskopischen Wahrmehmung. Archiv für Mikroskopische Anatomie. 1873;9:412–420.
-
- Hell SW, Wichmann J. Breaking the Diffraction Resolution Limit by Stimulated-Emission - Stimulated-Emission-Depletion Fluorescence Microscopy. Optics Letters. 1994;19:780–782. - PubMed
-
- Betzig E, Patterson GH, Sougrat R, Lindwasser OW, Olenych S, et al. Imaging intracellular fluorescent proteins at nanometer resolution. Science. 2006;313:1642–1645. - PubMed
Publication types
MeSH terms
Grants and funding
LinkOut - more resources
Full Text Sources

