

Phylogenomic datasets provide both precision and accuracy in estimating the timescale of placental mammal phylogeny
- PMID: 22628470
- PMCID: PMC3396900
- DOI: 10.1098/rspb.2012.0683
Phylogenomic datasets provide both precision and accuracy in estimating the timescale of placental mammal phylogeny
Abstract
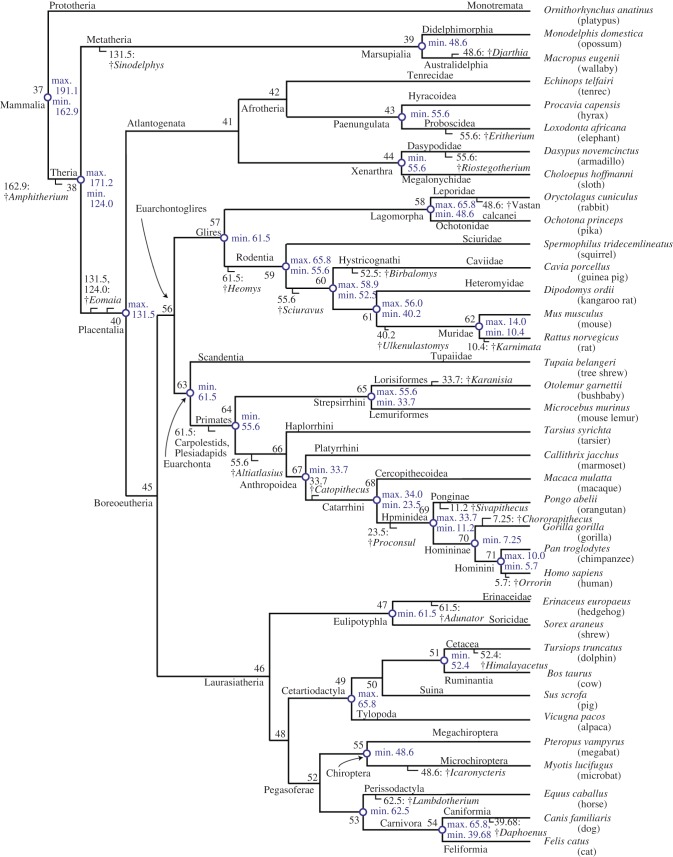
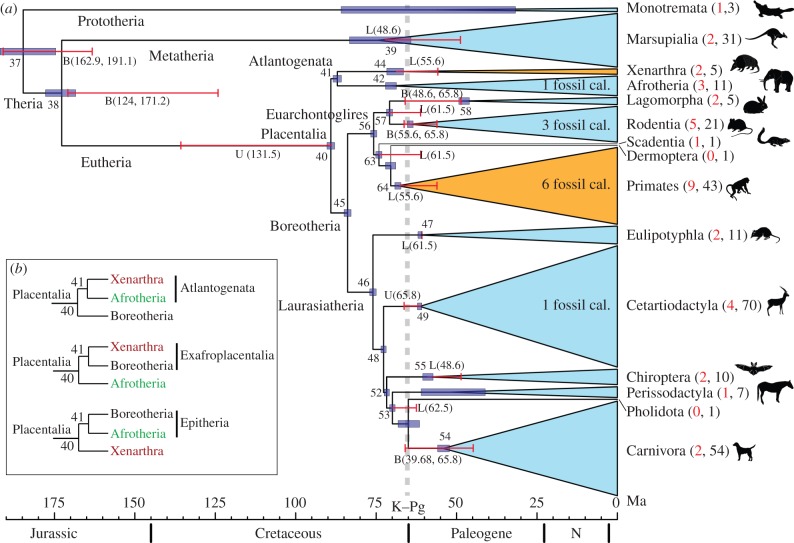
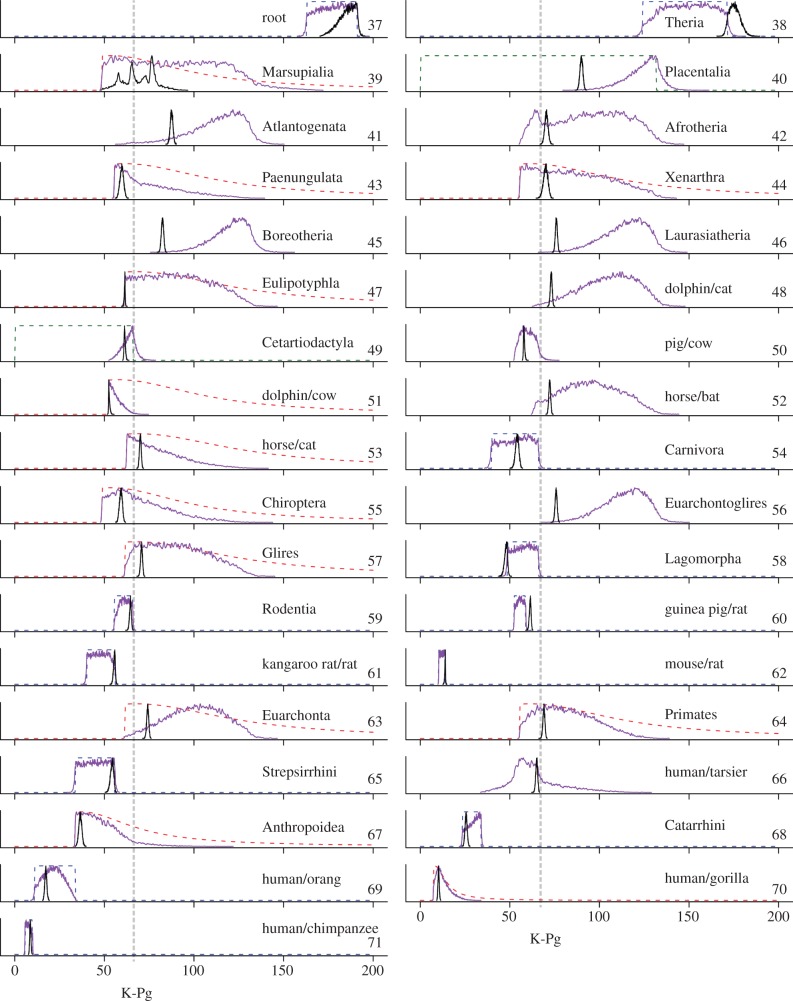
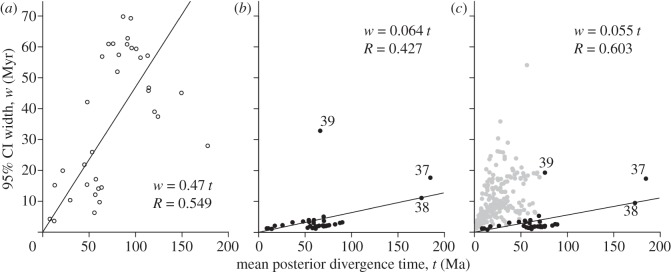
The fossil record suggests a rapid radiation of placental mammals following the Cretaceous-Paleogene (K-Pg) mass extinction 65 million years ago (Ma); nevertheless, molecular time estimates, while highly variable, are generally much older. Early molecular studies suffer from inadequate dating methods, reliance on the molecular clock, and simplistic and over-confident interpretations of the fossil record. More recent studies have used Bayesian dating methods that circumvent those issues, but the use of limited data has led to large estimation uncertainties, precluding a decisive conclusion on the timing of mammalian diversifications. Here we use a powerful Bayesian method to analyse 36 nuclear genomes and 274 mitochondrial genomes (20.6 million base pairs), combined with robust but flexible fossil calibrations. Our posterior time estimates suggest that marsupials diverged from eutherians 168-178 Ma, and crown Marsupialia diverged 64-84 Ma. Placentalia diverged 88-90 Ma, and present-day placental orders (except Primates and Xenarthra) originated in a ∼20 Myr window (45-65 Ma) after the K-Pg extinction. Therefore we reject a pre K-Pg model of placental ordinal diversification. We suggest other infamous instances of mismatch between molecular and palaeontological divergence time estimates will be resolved with this same approach.
Figures
Similar articles
-
A species-level timeline of mammal evolution integrating phylogenomic data.Nature. 2022 Feb;602(7896):263-267. doi: 10.1038/s41586-021-04341-1. Epub 2021 Dec 22. Nature. 2022. PMID: 34937052
-
A dating success story: genomes and fossils converge on placental mammal origins.Evodevo. 2012 Aug 10;3(1):18. doi: 10.1186/2041-9139-3-18. Evodevo. 2012. PMID: 22883371 Free PMC article.
-
The placental mammal ancestor and the post-K-Pg radiation of placentals.Science. 2013 Feb 8;339(6120):662-7. doi: 10.1126/science.1229237. Science. 2013. PMID: 23393258
-
[Molecular dating in the genomic era].Med Sci (Paris). 2006 Apr;22(4):374-80. doi: 10.1051/medsci/2006224374. Med Sci (Paris). 2006. PMID: 16597406 Review. French.
-
Molecular evidence for the early divergence of placental mammals.Bioessays. 1999 Dec;21(12):1052-8; discussion 1059. doi: 10.1002/(SICI)1521-1878(199912)22:1<1052::AID-BIES9>3.0.CO;2-6. Bioessays. 1999. PMID: 10580990 Review.
Cited by
-
Conflict Resolution for Mesozoic Mammals: Reconciling Phylogenetic Incongruence Among Anatomical Regions.Front Genet. 2020 Jul 8;11:0651. doi: 10.3389/fgene.2020.00651. eCollection 2020. Front Genet. 2020. PMID: 32774343 Free PMC article.
-
The Vγ9Vδ2 T Cell Antigen Receptor and Butyrophilin-3 A1: Models of Interaction, the Possibility of Co-Evolution, and the Case of Dendritic Epidermal T Cells.Front Immunol. 2014 Dec 19;5:648. doi: 10.3389/fimmu.2014.00648. eCollection 2014. Front Immunol. 2014. PMID: 25566259 Free PMC article. Review.
-
The origin and early evolution of metatherian mammals: the Cretaceous record.Zookeys. 2014 Dec 17;(465):1-76. doi: 10.3897/zookeys.465.8178. eCollection 2014. Zookeys. 2014. PMID: 25589872 Free PMC article.
-
Genomic analysis of snub-nosed monkeys (Rhinopithecus) identifies genes and processes related to high-altitude adaptation.Nat Genet. 2016 Aug;48(8):947-52. doi: 10.1038/ng.3615. Epub 2016 Jul 11. Nat Genet. 2016. PMID: 27399969
-
Molecular archeological evidence in support of the repeated loss of a papillomavirus gene.Sci Rep. 2016 Sep 8;6:33028. doi: 10.1038/srep33028. Sci Rep. 2016. PMID: 27604338 Free PMC article.
References
-
- Benton M. J., Ayala F. J. 2003. Dating the tree of life. Science 300, 1698–170010.1126/science.1077795 (doi:10.1126/science.1077795) - DOI - DOI - PubMed
-
- Archibald J. D., Deutschman D. H. 2001. Quantitative analysis of the timing of the origin and diversification of extant placental orders. J. Mamm. Evol. 8, 107–12410.1023/A:1011317930838 (doi:10.1023/A:1011317930838) - DOI - DOI
-
- Alroy J. 1999. The fossil record of north American mammals: evidence for a Paleocene evolutionary radiation. Syst. Biol. 48, 107–11810.1080/106351599260472 (doi:10.1080/106351599260472) - DOI - DOI - PubMed
-
- Kemp T. S. 2005. The origin and evolution of mammals. Oxford, UK: Oxford University Press
-
- Kumar S., Hedges S. B. 1998. A molecular timescale for vertebrate evolution. Nature 392, 917–92010.1038/31927 (doi:10.1038/31927) - DOI - DOI - PubMed
MeSH terms
Grants and funding
LinkOut - more resources
Full Text Sources
Other Literature Sources
