Algebraic comparison of partial lists in bioinformatics
- PMID: 22615778
- PMCID: PMC3355159
- DOI: 10.1371/journal.pone.0036540
Algebraic comparison of partial lists in bioinformatics
Abstract
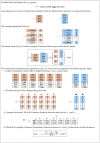
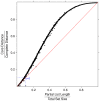
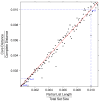
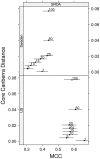
The outcome of a functional genomics pipeline is usually a partial list of genomic features, ranked by their relevance in modelling biological phenotype in terms of a classification or regression model. Due to resampling protocols or to a meta-analysis comparison, it is often the case that sets of alternative feature lists (possibly of different lengths) are obtained, instead of just one list. Here we introduce a method, based on permutations, for studying the variability between lists ("list stability") in the case of lists of unequal length. We provide algorithms evaluating stability for lists embedded in the full feature set or just limited to the features occurring in the partial lists. The method is demonstrated by finding and comparing gene profiles on a large prostate cancer dataset, consisting of two cohorts of patients from different countries, for a total of 455 samples.
Conflict of interest statement
Figures




 .
.


Similar articles
-
Algebraic stability indicators for ranked lists in molecular profiling.Bioinformatics. 2008 Jan 15;24(2):258-64. doi: 10.1093/bioinformatics/btm550. Epub 2007 Nov 16. Bioinformatics. 2008. PMID: 18024475
-
R2KS: a novel measure for comparing gene expression based on ranked gene lists.J Comput Biol. 2012 Jun;19(6):766-75. doi: 10.1089/cmb.2012.0026. J Comput Biol. 2012. PMID: 22697246
-
DAVID Bioinformatics Resources: expanded annotation database and novel algorithms to better extract biology from large gene lists.Nucleic Acids Res. 2007 Jul;35(Web Server issue):W169-75. doi: 10.1093/nar/gkm415. Epub 2007 Jun 18. Nucleic Acids Res. 2007. PMID: 17576678 Free PMC article.
-
Functional genomics and proteomics in the clinical neurosciences: data mining and bioinformatics.Prog Brain Res. 2006;158:83-108. doi: 10.1016/S0079-6123(06)58004-5. Prog Brain Res. 2006. PMID: 17027692 Review.
-
List of lists-annotated (LOLA): a database for annotation and comparison of published microarray gene lists.Gene. 2005 Oct 24;360(1):78-82. doi: 10.1016/j.gene.2005.07.008. Epub 2005 Sep 2. Gene. 2005. PMID: 16140476 Review.
Cited by
-
A machine learning pipeline for quantitative phenotype prediction from genotype data.BMC Bioinformatics. 2010 Oct 26;11 Suppl 8(Suppl 8):S3. doi: 10.1186/1471-2105-11-S8-S3. BMC Bioinformatics. 2010. PMID: 21034428 Free PMC article.
-
Phylogenetic convolutional neural networks in metagenomics.BMC Bioinformatics. 2018 Mar 8;19(Suppl 2):49. doi: 10.1186/s12859-018-2033-5. BMC Bioinformatics. 2018. PMID: 29536822 Free PMC article.
-
Effect of size and heterogeneity of samples on biomarker discovery: synthetic and real data assessment.PLoS One. 2012;7(3):e32200. doi: 10.1371/journal.pone.0032200. Epub 2012 Mar 5. PLoS One. 2012. PMID: 22403633 Free PMC article.
-
Pathways-driven sparse regression identifies pathways and genes associated with high-density lipoprotein cholesterol in two Asian cohorts.PLoS Genet. 2013 Nov;9(11):e1003939. doi: 10.1371/journal.pgen.1003939. Epub 2013 Nov 21. PLoS Genet. 2013. PMID: 24278029 Free PMC article.
-
Self-perceived loneliness and depression during the Covid-19 pandemic: a two-wave replication study.UCL Open Environ. 2022 Nov 3;4:e051. doi: 10.14324/111.444/ucloe.000051. eCollection 2022. UCL Open Environ. 2022. PMID: 37228475 Free PMC article.
References
Publication types
MeSH terms
LinkOut - more resources
Full Text Sources

