

Reduced mature microRNA levels in association with dicer loss in human temporal lobe epilepsy with hippocampal sclerosis
- PMID: 22615744
- PMCID: PMC3352899
- DOI: 10.1371/journal.pone.0035921
Reduced mature microRNA levels in association with dicer loss in human temporal lobe epilepsy with hippocampal sclerosis
Abstract
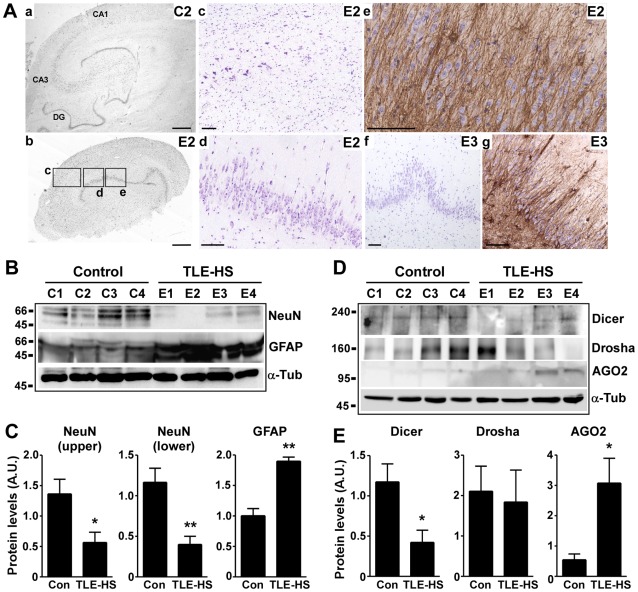
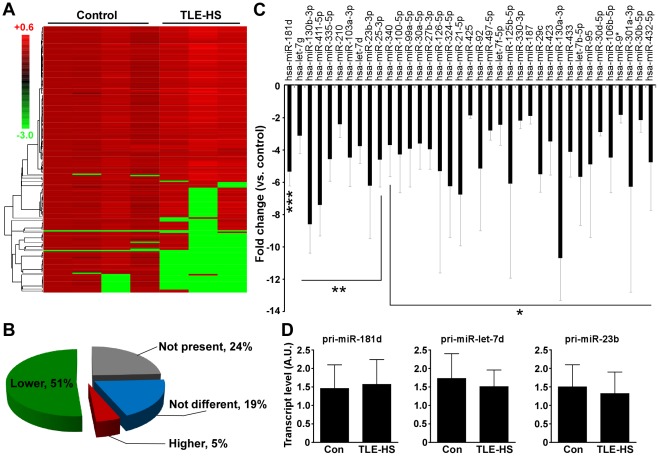
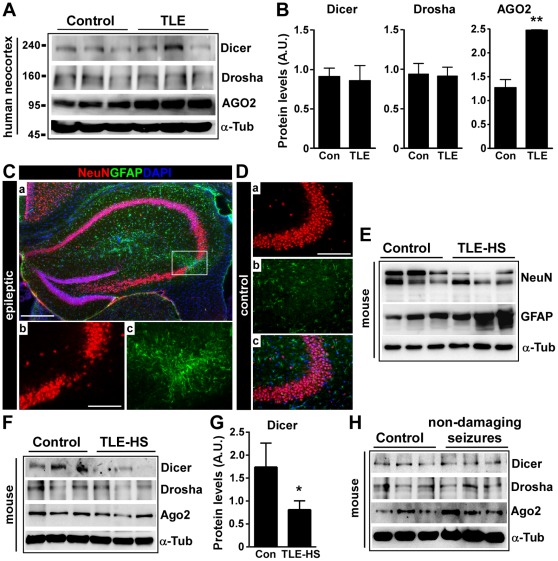
Hippocampal sclerosis (HS) is a common pathological finding in patients with temporal lobe epilepsy (TLE) and is associated with altered expression of genes controlling neuronal excitability, glial function, neuroinflammation and cell death. MicroRNAs (miRNAs), a class of small non-coding RNAs, function as post-transcriptional regulators of gene expression and are critical for normal brain development and function. Production of mature miRNAs requires Dicer, an RNAase III, loss of which has been shown to cause neuronal and glial dysfunction, seizures, and neurodegeneration. Here we investigated miRNA biogenesis in hippocampal and neocortical resection specimens from pharmacoresistant TLE patients and autopsy controls. Western blot analysis revealed protein levels of Dicer were significantly lower in certain TLE patients with HS. Dicer levels were also reduced in the hippocampus of mice subject to experimentally-induced epilepsy. To determine if Dicer loss was associated with altered miRNA processing, we profiled levels of 380 mature miRNAs in control and TLE-HS samples. Expression of nearly 200 miRNAs was detected in control human hippocampus. In TLE-HS samples there was a large-scale reduction of miRNA expression, with 51% expressed at lower levels and a further 24% not detectable. Primary transcript (pri-miRNAs) expression levels for several tested miRNAs were not different between control and TLE-HS samples. These findings suggest loss of Dicer and failure of mature miRNA expression may be a feature of the pathophysiology of HS in patients with TLE.
Conflict of interest statement
Figures
Similar articles
-
MicroRNA and mesial temporal lobe epilepsy with hippocampal sclerosis: Whole miRNome profiling of human hippocampus.Epilepsia. 2017 Oct;58(10):1782-1793. doi: 10.1111/epi.13870. Epub 2017 Aug 16. Epilepsia. 2017. PMID: 28815576
-
The MicroRNA Expression Profiles of Human Temporal Lobe Epilepsy in HS ILAE Type 1.Cell Mol Neurobiol. 2019 Apr;39(3):461-470. doi: 10.1007/s10571-019-00662-y. Epub 2019 Feb 21. Cell Mol Neurobiol. 2019. PMID: 30790096
-
Quantitative expression and localization of GABAB receptor protein subunits in hippocampi from patients with refractory temporal lobe epilepsy.Neuropharmacology. 2018 Jul 1;136(Pt A):117-128. doi: 10.1016/j.neuropharm.2017.08.001. Epub 2017 Aug 3. Neuropharmacology. 2018. PMID: 28782512
-
Molecular neuropathology of temporal lobe epilepsy: complementary approaches in animal models and human disease tissue.Epilepsia. 2007;48 Suppl 2:4-12. doi: 10.1111/j.1528-1167.2007.01062.x. Epilepsia. 2007. PMID: 17571348 Review.
-
MicroRNA and Rare Human Diseases.Genes (Basel). 2024 Sep 25;15(10):1243. doi: 10.3390/genes15101243. Genes (Basel). 2024. PMID: 39457367 Free PMC article. Review.
Cited by
-
Developmental and activity-dependent miRNA expression profiling in primary hippocampal neuron cultures.PLoS One. 2013 Oct 3;8(10):e74907. doi: 10.1371/journal.pone.0074907. eCollection 2013. PLoS One. 2013. PMID: 24098357 Free PMC article.
-
Novel therapeutic approaches for disease-modification of epileptogenesis for curing epilepsy.Biochim Biophys Acta Mol Basis Dis. 2017 Jun;1863(6):1519-1538. doi: 10.1016/j.bbadis.2017.02.003. Epub 2017 Feb 5. Biochim Biophys Acta Mol Basis Dis. 2017. PMID: 28179120 Free PMC article. Review.
-
MicroRNAs tune cerebral cortical neurogenesis.Cell Death Differ. 2012 Oct;19(10):1573-81. doi: 10.1038/cdd.2012.96. Epub 2012 Aug 3. Cell Death Differ. 2012. PMID: 22858543 Free PMC article. Review.
-
Epigenetic mechanisms of neurodegenerative diseases and acute brain injury.Neurochem Int. 2020 Feb;133:104642. doi: 10.1016/j.neuint.2019.104642. Epub 2019 Dec 12. Neurochem Int. 2020. PMID: 31838024 Free PMC article. Review.
-
Transfer RNA-Derived Fragments and isomiRs Are Novel Components of Chronic TBI-Induced Neuropathology.Biomedicines. 2022 Jan 8;10(1):136. doi: 10.3390/biomedicines10010136. Biomedicines. 2022. PMID: 35052815 Free PMC article.
References
-
- Bartel DP. MicroRNAs: genomics, biogenesis, mechanism, and function. Cell. 2004;116:281–297. - PubMed
-
- Lee Y, Ahn C, Han J, Choi H, Kim J, et al. The nuclear RNase III Drosha initiates microRNA processing. Nature. 2003;425:415–419. - PubMed
-
- Kim VN, Han J, Siomi MC. Biogenesis of small RNAs in animals. Nat Rev Mol Cell Biol. 2009;10:126–139. - PubMed
-
- Krol J, Loedige I, Filipowicz W. The widespread regulation of microRNA biogenesis, function and decay. Nat Rev Genet. 2010;11:597–610. - PubMed
-
- Coolen M, Bally-Cuif L. MicroRNAs in brain development and physiology. Curr Opin Neurobiol. 2009;19:461–470. - PubMed
Publication types
MeSH terms
Substances
Grants and funding
LinkOut - more resources
Full Text Sources
Other Literature Sources
