

Hyaline cartilage tissue is formed through the co-culture of passaged human chondrocytes and primary bovine chondrocytes
- PMID: 22610463
- PMCID: PMC3460363
- DOI: 10.1369/0022155412449018
Hyaline cartilage tissue is formed through the co-culture of passaged human chondrocytes and primary bovine chondrocytes
Abstract
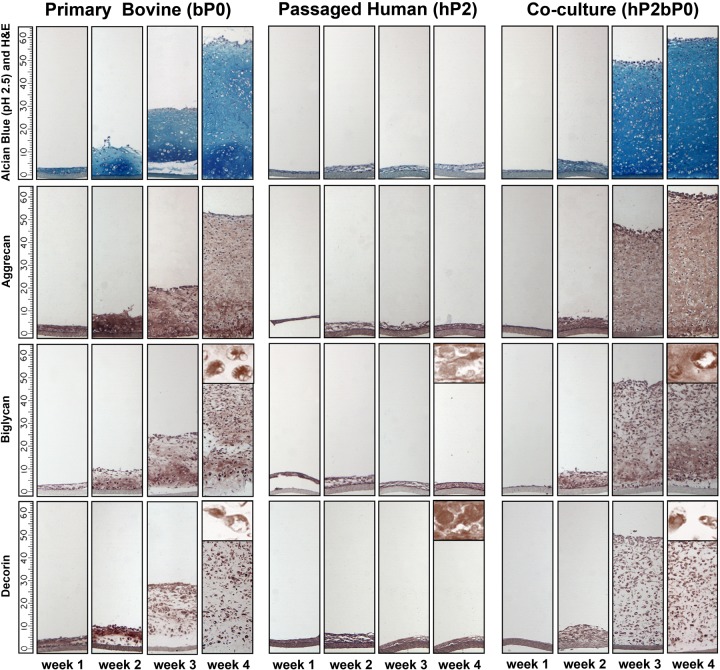
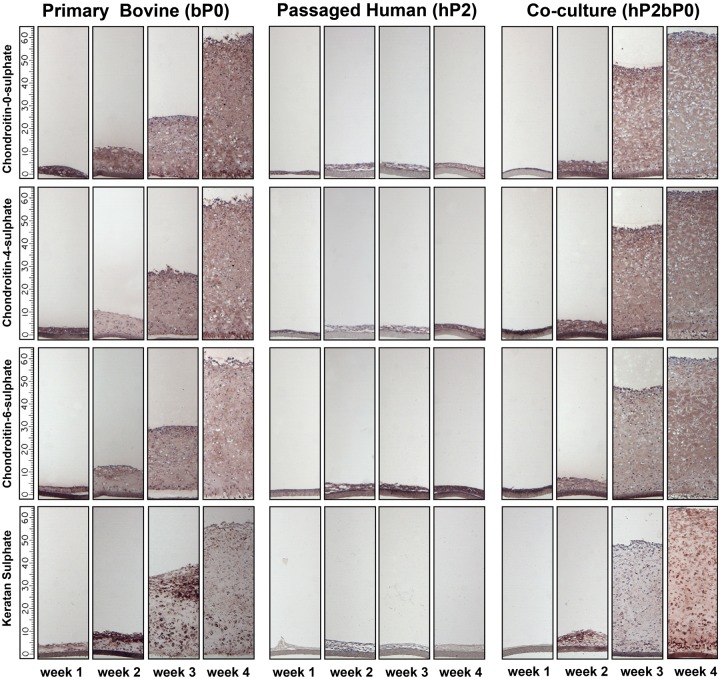
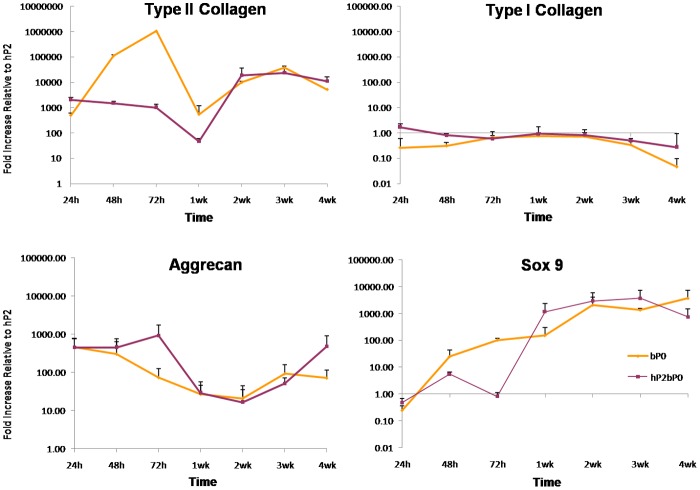
To circumvent the problem of a sufficient number of cells for cartilage engineering, the authors previously developed a two-stage culture system to redifferentiate monolayer culture-expanded dedifferentiated human articular chondrocytes by co-culture with primary bovine chondrocytes (bP0). The aim of this study was to analyze the composition of the cartilage tissue formed in stage 1 and compare it with bP0 grown alone to determine the optimal length of the co-culture stage of the system. Biochemical data show that extracellular matrix accumulation was evident after 2 weeks of co-culture, which was 1 week behind the bP0 control culture. By 3 to 4 weeks, the amounts of accumulated proteoglycans and collagens were comparable. Expression of chondrogenic genes, Sox 9, aggrecan, and collagen type II, was also at similar levels by week 3 of culture. Immunohistochemical staining of both co-culture and control tissues showed accumulation of type II collagen, aggrecan, biglycan, decorin, and chondroitin sulfate in appropriate zonal distributions. These data indicate that co-cultured cells form cartilaginous tissue that starts to resemble that formed by bP0 after 3 weeks, suggesting that the optimal time to terminate the co-culture stage, isolate the now redifferentiated cells, and start stage 2 is just after 3 weeks.
Figures


Similar articles
-
Collagen type XII and versican are present in the early stages of cartilage tissue formation by both redifferentating passaged and primary chondrocytes.Tissue Eng Part A. 2015 Feb;21(3-4):683-93. doi: 10.1089/ten.TEA.2014.0103. Epub 2014 Dec 16. Tissue Eng Part A. 2015. PMID: 25315796
-
Proteoglycan and collagen accumulation by passaged chondrocytes can be enhanced through side-by-side culture with primary chondrocytes.Tissue Eng Part A. 2010 Feb;16(2):643-51. doi: 10.1089/ten.TEA.2009.0236. Tissue Eng Part A. 2010. PMID: 19754222
-
Redifferentiated Chondrocytes in Fibrin Gel for the Repair of Articular Cartilage Lesions.Am J Sports Med. 2019 Aug;47(10):2348-2359. doi: 10.1177/0363546519857571. Epub 2019 Jul 2. Am J Sports Med. 2019. PMID: 31265317
-
Passaged human chondrocytes accumulate extracellular matrix when induced by bovine chondrocytes.J Tissue Eng Regen Med. 2010 Mar;4(3):233-41. doi: 10.1002/term.235. J Tissue Eng Regen Med. 2010. PMID: 19998328
-
In vitro cartilage tissue formation by Co-culture of primary and passaged chondrocytes.Tissue Eng. 2007 Apr;13(4):831-42. doi: 10.1089/ten.2006.0231. Tissue Eng. 2007. PMID: 17253927
Cited by
-
Concise review: unraveling stem cell cocultures in regenerative medicine: which cell interactions steer cartilage regeneration and how?Stem Cells Transl Med. 2014 Jun;3(6):723-33. doi: 10.5966/sctm.2013-0207. Epub 2014 Apr 24. Stem Cells Transl Med. 2014. PMID: 24763684 Free PMC article. Review.
-
The interplay between chondrocyte spheroids and mesenchymal stem cells boosts cartilage regeneration within a 3D natural-based hydrogel.Sci Rep. 2019 Oct 10;9(1):14630. doi: 10.1038/s41598-019-51070-7. Sci Rep. 2019. PMID: 31601910 Free PMC article.
-
Efficient, Low-Cost Nucleofection of Passaged Chondrocytes.Cartilage. 2016 Jan;7(1):82-91. doi: 10.1177/1947603515609399. Cartilage. 2016. PMID: 26958320 Free PMC article.
-
An Innovative Laboratory Procedure to Expand Chondrocytes with Reduced Dedifferentiation.Cartilage. 2018 Apr;9(2):202-211. doi: 10.1177/1947603517746724. Epub 2017 Dec 22. Cartilage. 2018. PMID: 29271232 Free PMC article.
-
Three-dimensional scaffold-free fusion culture: the way to enhance chondrogenesis of in vitro propagated human articular chondrocytes.Eur J Histochem. 2013 Nov 5;57(4):e31. doi: 10.4081/ejh.2013.e31. Eur J Histochem. 2013. PMID: 24441184 Free PMC article.
References
-
- Ahmed N, Gan L, Nagy A, Zheng J, Wang C, Kandel RA. 2009. Cartilage tissue formation using redifferentiated passaged chondrocytes in vitro. Tissue Eng Part A. 13:665–673 - PubMed
-
- Ahmed N, Taylor DW, Wunder J, Nagy A, Gross AE, Kandel RA. 2010. Passaged human chondrocytes accumulate extracellular matrix when induced by bovine chondrocytes. J Tissue Eng Regen Med. 4:233–241 - PubMed
-
- Asher R, Bignami A. 1991. Localization of hyaluronate in primary glial cell cultures derived from newborn rat brain. Exp Cell Res. 195:401–411 - PubMed
-
- Bayliss MT, Davidson C, Woodhouse SM, Osborne DJ. 1995. Chondroitin sulphation in human joint tissues varies with age, zone and topography. Acta Orthop Scand. 266(Suppl.): 22–25 - PubMed
-
- Bayliss MT, Osborne D, Woodhouse S, Davidson C. 1999. Sulfation of chondroitin sulfate in human articular cartilage: the effect of age, topographical position, and zone of cartilage on tissue composition. J Biol Chem. 274:15892–15900 - PubMed
Publication types
MeSH terms
Substances
Grants and funding
LinkOut - more resources
Full Text Sources
Miscellaneous
