

Dasatinib therapy results in decreased B cell proliferation, splenomegaly, and tumor growth in a murine model of lymphoma expressing Myc and Epstein-Barr virus LMP2A
- PMID: 22609829
- PMCID: PMC3377840
- DOI: 10.1016/j.antiviral.2012.05.003
Dasatinib therapy results in decreased B cell proliferation, splenomegaly, and tumor growth in a murine model of lymphoma expressing Myc and Epstein-Barr virus LMP2A
Abstract
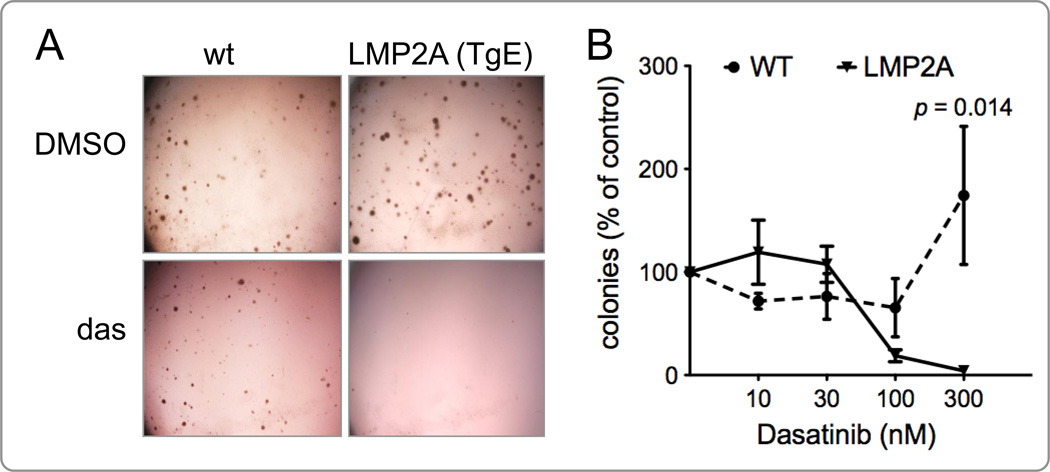
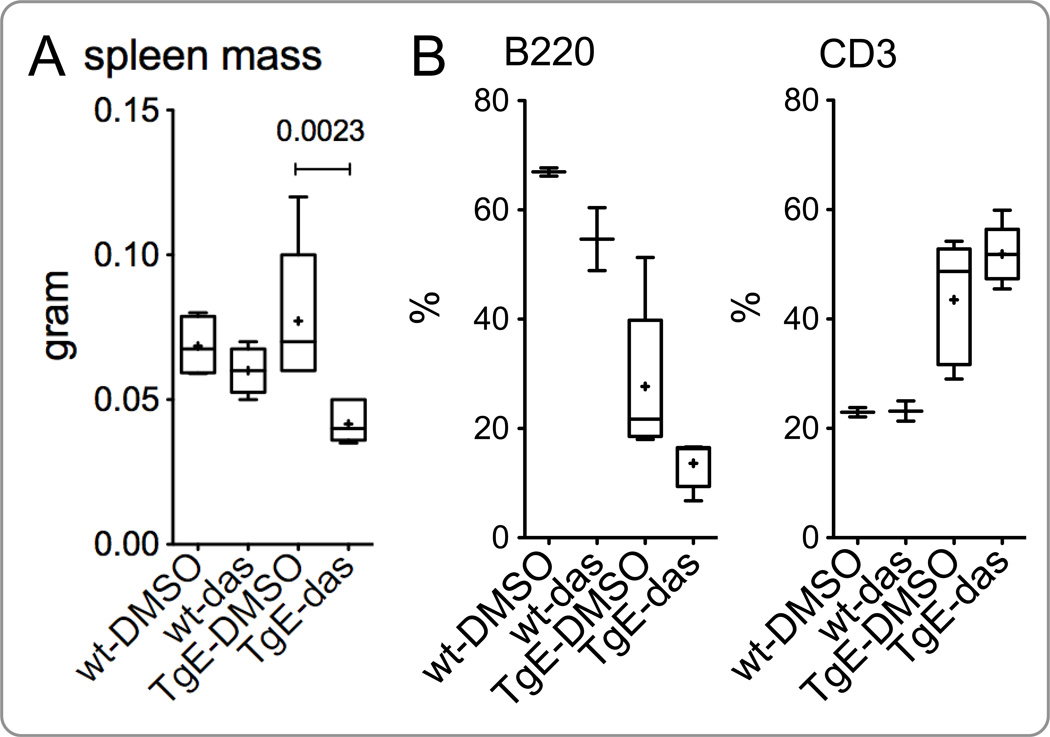
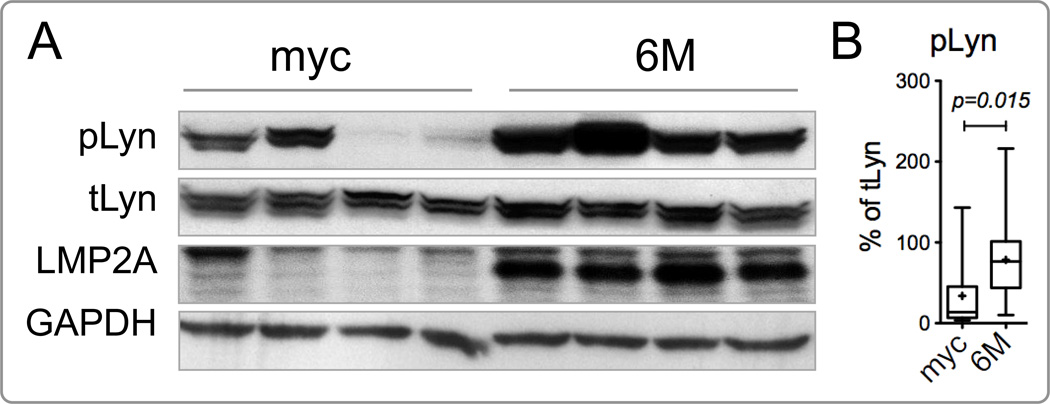
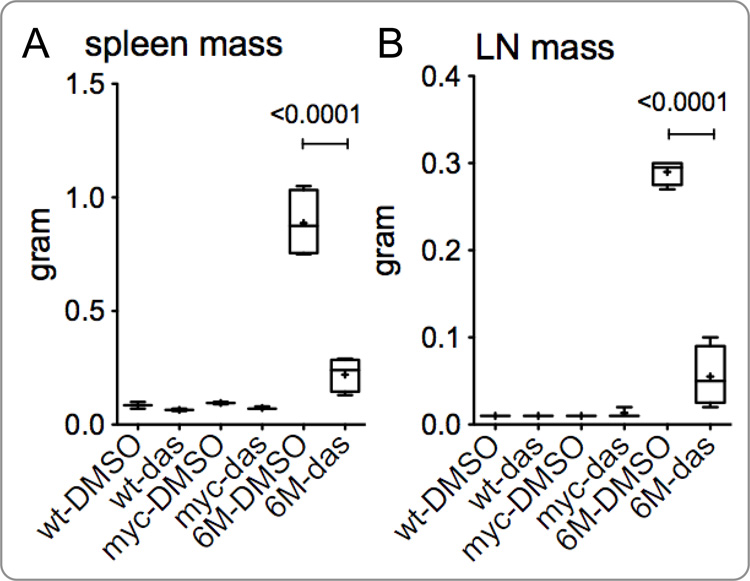
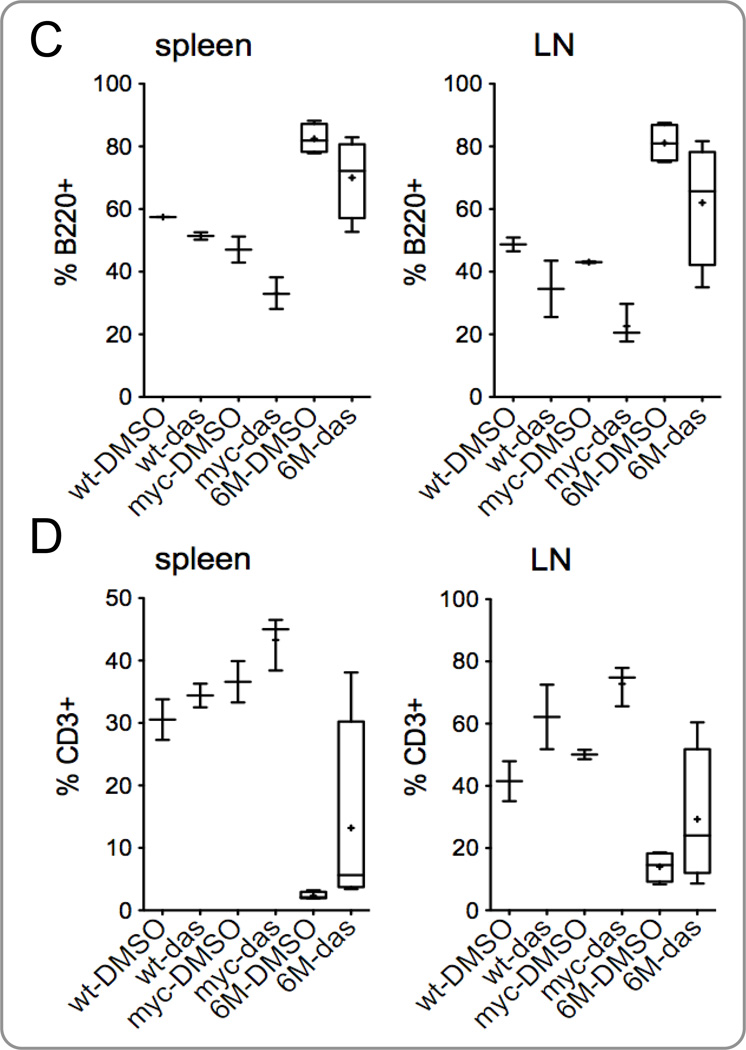
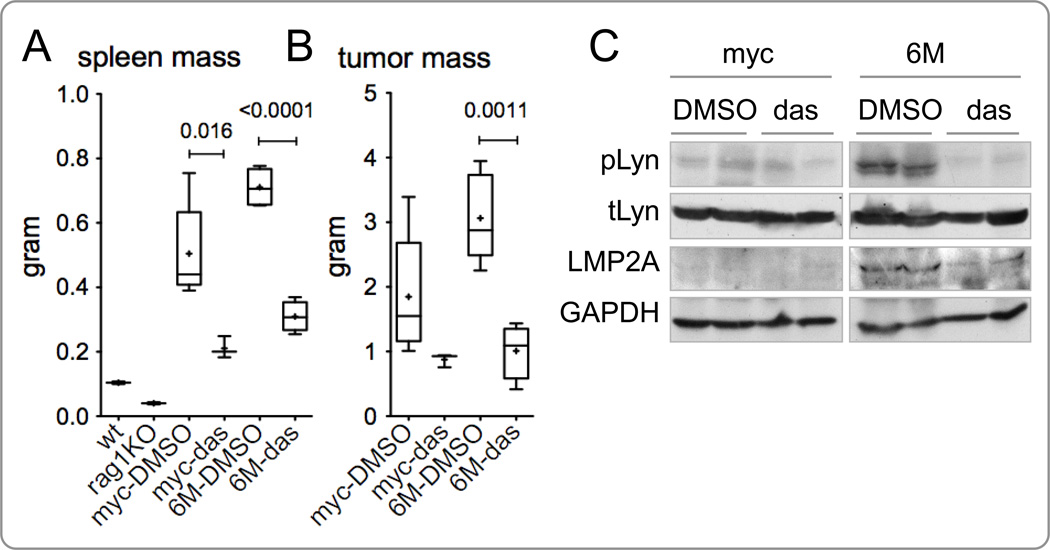
Epstein-Barr virus (EBV) infection and latency has been associated with malignant diseases including nasopharyngeal carcinoma, Hodgkin lymphoma, Burkitt lymphoma, and immune deficiency associated lymphoproliferative diseases. EBV-encoded latent membrane protein 2A (LMP2A) recruits Lyn and Syk kinases via its SH2-domain binding motifs, and modifies their signaling pathways. LMP2A transgenic mice develop hyperproliferative bone marrow B cells and immature peripheral B cells through modulation of Lyn kinase signaling. LMP2A/λ-MYC double transgenic mice develop splenomegaly and cervical lymphomas starting at 8 weeks of age. We reasoned that targeting Lyn in LMP2A-expressing B cells with dasatinib would provide a therapeutic option for EBV-associated malignancies. Here, we show that dasatinib inhibits B cell colony formation by LMP2A transgenic bone marrow cells, and reverses splenomegaly and tumor growth in both a pre-tumor and a syngeneic tumor transfer model of EBV-associated Burkitt lymphoma. Our data support the idea that dasatinib may prove to be an effective therapeutic molecule for the treatment of EBV-associated malignancies.
Copyright © 2012 Elsevier B.V. All rights reserved.
Conflict of interest statement
The authors have no potential conflicts of interest to disclose.
Figures
Similar articles
-
Rapamycin reverses splenomegaly and inhibits tumor development in a transgenic model of Epstein-Barr virus-related Burkitt's lymphoma.Mol Cancer Ther. 2011 Apr;10(4):679-86. doi: 10.1158/1535-7163.MCT-10-0833. Epub 2011 Jan 31. Mol Cancer Ther. 2011. PMID: 21282357 Free PMC article.
-
Spleen Tyrosine Kinase Inhibitor TAK-659 Prevents Splenomegaly and Tumor Development in a Murine Model of Epstein-Barr Virus-Associated Lymphoma.mSphere. 2018 Aug 22;3(4):e00378-18. doi: 10.1128/mSphereDirect.00378-18. mSphere. 2018. PMID: 30135222 Free PMC article.
-
Two Pathways of p27Kip1 Degradation Are Required for Murine Lymphoma Driven by Myc and EBV Latent Membrane Protein 2A.mBio. 2019 Apr 16;10(2):e00548-19. doi: 10.1128/mBio.00548-19. mBio. 2019. PMID: 30992353 Free PMC article.
-
The signaling pathways of Epstein-Barr virus-encoded latent membrane protein 2A (LMP2A) in latency and cancer.Cell Mol Biol Lett. 2009;14(2):222-47. doi: 10.2478/s11658-008-0045-2. Epub 2008 Dec 13. Cell Mol Biol Lett. 2009. PMID: 19082921 Free PMC article. Review.
-
The effects of the Epstein-Barr virus latent membrane protein 2A on B cell function.Int Rev Immunol. 2001;20(6):805-35. doi: 10.3109/08830180109045591. Int Rev Immunol. 2001. PMID: 11913951 Review.
Cited by
-
Viral-Targeted Strategies Against EBV-Associated Lymphoproliferative Diseases.Front Oncol. 2019 Feb 26;9:81. doi: 10.3389/fonc.2019.00081. eCollection 2019. Front Oncol. 2019. PMID: 30873380 Free PMC article. Review.
-
NHE9 induces chemoradiotherapy resistance in esophageal squamous cell carcinoma by upregulating the Src/Akt/β-catenin pathway and Bcl-2 expression.Oncotarget. 2015 May 20;6(14):12405-20. doi: 10.18632/oncotarget.3618. Oncotarget. 2015. PMID: 25915159 Free PMC article.
-
Activity of the novel BCR kinase inhibitor IQS019 in preclinical models of B-cell non-Hodgkin lymphoma.J Hematol Oncol. 2017 Mar 31;10(1):80. doi: 10.1186/s13045-017-0447-6. J Hematol Oncol. 2017. PMID: 28359287 Free PMC article.
-
EBV-related lymphomas: new approaches to treatment.Curr Treat Options Oncol. 2013 Jun;14(2):224-36. doi: 10.1007/s11864-013-0231-y. Curr Treat Options Oncol. 2013. PMID: 23549980 Free PMC article.
-
Drug Modulators of B Cell Signaling Pathways and Epstein-Barr Virus Lytic Activation.J Virol. 2017 Jul 27;91(16):e00747-17. doi: 10.1128/JVI.00747-17. Print 2017 Aug 15. J Virol. 2017. PMID: 28566383 Free PMC article.
References
-
- Adams JM, Harris AW, Pinkert CA, Corcoran LM, Alexander WS, Cory S, Palmiter RD, Brinster RL. The c-myc oncogene driven by immunoglobulin enhancers induces lymphoid malignancy in transgenic mice. Nature. 1985;318:533–538. - PubMed
-
- Babcock GJ, Decker LL, Volk M, Thorley-Lawson DA. EBV persistence in memory B cells in vivo. Immunity. 1998;9:395–404. - PubMed
-
- Babcock GJ, Hochberg D, Thorley-Lawson AD. The expression pattern of Epstein-Barr virus latent genes in vivo is dependent upon the differentiation stage of the infected B cell. Immunity. 2000;13:497–506. - PubMed
-
- Bell AI, Groves K, Kelly GL, Croom-Carter D, Hui E, Chan AT, Rickinson AB. Analysis of Epstein-Barr virus latent gene expression in endemic Burkitt's lymphoma and nasopharyngeal carcinoma tumour cells by using quantitative real-time PCR assays. J Gen Virol. 2006;87:2885–2890. - PubMed
Publication types
MeSH terms
Substances
Grants and funding
LinkOut - more resources
Full Text Sources
Other Literature Sources
Miscellaneous
