. 2012 Oct;19(10):1722-32.
doi: 10.1038/cdd.2012.54. Epub 2012 May 18.

PIDDosome-independent tumor suppression by Caspase-2

Affiliations

PIDDosome-independent tumor suppression by Caspase-2

C Manzl et al. Cell Death Differ. 2012 Oct.

Abstract

The PIDDosome, a multiprotein complex constituted of the 'p53-induced protein with a death domain (PIDD), 'receptor-interacting protein (RIP)-associated ICH-1/CED-3 homologous protein with a death domain' (RAIDD) and pro-Caspase-2 has been defined as an activating platform for this apoptosis-related protease. PIDD has been implicated in p53-mediated cell death in response to DNA damage but also in DNA repair and nuclear factor kappa-light-chain enhancer (NF-κB) activation upon genotoxic stress, together with RIP-1 kinase and Nemo/IKKγ. As all these cellular responses are critical for tumor suppression and deregulated expression of individual PIDDosome components has been noted in human cancer, we investigated their role in oncogenesis induced by DNA damage or oncogenic stress in gene-ablated mice. We observed that Pidd or Caspase-2 failed to suppress lymphoma formation triggered by γ-irradiation or 3-methylcholanthrene-driven fibrosarcoma development. In contrast, Caspase-2 showed tumor suppressive capacity in response to aberrant c-Myc expression, which did not rely on PIDD, the BH3-only protein Bid (BH3 interacting domain death agonist) or the death receptor ligand Trail (TNF-related apoptosis-inducing ligand), but associated with reduced rates of p53 loss and increased extranodal dissemination of tumor cells. In contrast, Pidd deficiency associated with abnormal M-phase progression and delayed disease onset, indicating that both proteins are differentially engaged upon oncogenic stress triggered by c-Myc, leading to opposing effects on tumor-free survival.


Figures
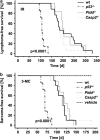
Figure 1
Figure 1
Loss of Pidd or Caspase-2 has no influence on DNA damage-induced tumorigenesis. (a) Tumor-free survival of wt (n=18), Pidd/ (n=6) and Casp2/ (n=16) mice after fractionated irradiation (4 × 1.75 Gy). No difference in the development of thymic lymphomas between the genotypes was observed. P53−/− mice (n=7) were included as positive controls, and earlier onset of thymic lymphomas was monitored (P<0.0001). (b) Tumor-free survival of wt (n=11), Pidd/ (n=10), Casp2/ (n=11) and p53+/ (n=7) mice after a single injection of 3-MC or vehicle (sesame oil; n=7) to induce fibrosarcomas. Sarcomas occurred significantly earlier in p53+/ animals compared with wt mice (P<0.0001)
Figure 2
Figure 2
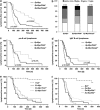
Opposing effects of individual PIDDosome components on c-Myc-induced lymphomagenesis. (a) Cohorts of Eμ-Myc (n=42), Eμ-Myc/Pidd/ (n=41) and Eμ-Myc/Casp2/ (n=25) mice were monitored for the development of B-cell lymphomas over time. Eμ-Myc mice lacking Caspase-2 showed a significantly earlier onset of lymphomagenesis (P=0.0044) compared with wt Eμ-Myc, while Pidd deficiency delayed lymphomagenesis in Eμ-mice (P=0.0005). (b) Distribution of pro/pre-B (white), mixed IgM+/ (light gray), IgM+ (dark gray) and B220+CD4+ (black) lymphomas analyzed from mice of the indicated genotypes. The distribution of lymphomas in Eμ-Myc/Casp2/ was significantly different (P=0.004) compared with wt Eμ-Myc due to the higher amount of mixed and IgM+ tumors. Kaplan–Meier analysis was depicted as (c) pre-B and (d) IgM+ B lymphomas of indicated genotypes. In Eμ-Myc/Casp2/ mice, IgM+ tumors developed significantly earlier than in Eμ-Myc animals (P=0.0028). (e) Kaplan–Meier analysis of Bid−/− (n=13), Eμ-Myc (median survival 97 d, n=18), Eμ-Myc/Bid+/− (median survival 137 d, n=35) and Eμ-Myc/Bid−/− (median survival 134 d, n=25) is shown. (f) Cohorts of Trail−/− (n=22), Eμ-Myc (median survival 113 d, n=21), Eμ-Myc/Trail+/ (median survival 125 d, n=50) and Eμ-Myc/Trail/ (median survival 164 d, n=20) mice were monitored for the development of B-cell lymphomas over time
Figure 3
Figure 3
Loss of Caspase-2 relieves the pressure to lose p53. (a) Representative western blot analysis of p19ARF and p53 expression in tumors derived from Eμ-Myc, Eμ-Myc/Pidd/ and Eμ-Myc/Casp2−/−. GAPDH serves as a loading control. In the last lane, a lysate derived from Eμ-Myc/Casp2/ (B10) or Eμ-Myc lymphoma (E91) is loaded as positive control. (b) Kaplan–Meier analysis of lymphomagenesis in mice with normal p53 or modified p53 status (mutated or lost, as assessed by western blotting in a). (c) Cohorts of Eμ-Myc/p53+/− (n=5), and Eμ-Myc/p53+/−/Casp2/ (n=5) mice were monitored for the development of B-cell lymphomas over time and data are depicted as tumor-free survival in a Kaplan–Meier analysis
Figure 4
Figure 4
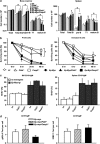
Normal cell death and proliferation rates in PIDDosome-defective premalignant B cells. (a) Distribution of B-cell subsets in bone marrow, or spleens of mice of the indicated genotypes. Single-cell suspensions derived from premalignant animals 5 weeks of age were counted, stained for different B-cell markers and analyzed by flow cytometry. Data are represented as means of n>4 animals/genotype ±S.E.M. *P<0.05 compared with Eμ-Myc controls, §P<0.05 compared with Eμ-Myc/Casp2−/− mice. (b) Sorted pre-B cells from the bone marrow (CD19+IgMCD43), immature B cells (IgM+IgDlow) from the spleens of mice of the indicated genotypes were cultured for 0, 6, 24 and 48 h cells and cell survival in CD19+ B cells was monitored by Annexin V/PI staining and flow cytometric analysis. Data points represent mean values±S.E.M. from n>3 cell mice/genotypes. *P<0.05 all Eμ-myc versus all non-transgenic genotypes (ANOVA and Student–Newman–Keuls test). (c) BrdU incorporation was determined in CD19+IgM pro/pre-B cells isolated from bone marrow (left) and mature CD19+IgM+ B cells isolated from spleen (right) from indicated genotypes (5 weeks old). Data are mean values±S.E.M from n>4 mice/genotypes. (d) Mature B cells (CD19+IgM+), sorted from spleens derived from premalignant mice of the indicated genotypes, were stained for γH2AX or 53BP-1 and foci/cells is depicted as bar graphs of mean values±S.E.M. of n>3 preparations from individual animals
Figure 5
Figure 5
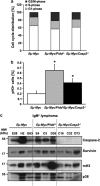
Lack of Pidd or Caspase-2 leads to a deregulation of cell cycle in Eμ-Myc tumors. (a) Cell cycle-distribution is depicted with G1 phase (white), S phase (light gray) and G2/M phase (dark gray) in tumor cells freshly isolated from Eμ-Myc (n=23), Eμ-Myc/Pidd−/− (n=8) and Eμ-Myc/Casp2−/− (n=13). (b) Tumor cells of wt Eμ-Myc (n=17), Eμ-Myc/Pidd−/− (n=8) and Eμ-Myc/Casp2−/− (n=13) were co-stained for mitosis-marker pH3 and PI. Bars represent percentages of pH3-positive cells ±S.E.M. *P<0.05. (c) Representative western blot analysis quantifying Caspase-2, Survivin or Lys9 pan-methyl H3 (mH3) levels in IgM+ tumors derived from Eμ-Myc, Eμ-Myc/Pidd/ and Eμ-Myc/Casp2−/−. Detection of p38 MAPK served as a loading control
Figure 6
Figure 6
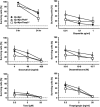
The PIDDosome is dispensible for drug-induced apoptosis in Eμ-Myc lymphomas. Freshly isolated tumor cells from indicated genotypes were cultivated on irradiated Bcl-2 overexpressing NIH-3T3 feeder cells and stimulated with graded doses of different drugs for 24 h. Apoptotic cell death was investigated using Annexin V/7-AAD in combination with anti-CD19 mAb and flow cytometric analysis. Data points represent means of n>3 tumor samples/genotype ±S.E.M.
Figure 7
Figure 7
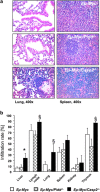
Loss of Caspase-2 promotes dissemination of Eμ-Myc lymphomas. (a) Representative images of H&E-stained sections from lung (left panel) and spleen (right panel) from mice of the indicated genotypes showing tumor manifestation ( × 400 magnification). (b) Percentage of tumor infiltrated area in indicated organs and genotypes quantified from H&E-stained sections of n>6 mice per genotype. Data are represented as mean values±S.E.M. *Indicate significant difference with a P-value of <0.05 comparing Eμ-Myc/Casp2−/− with Eμ-Myc or Eμ-Myc/Pidd−/− mice, respectively

Similar articles

Cited by

References

    1. Vakifahmetoglu-Norberg H, Zhivotovsky B. The unpredictable caspase-2: what can it do. Trends Cell Biol. 2010;20:150–159. - PubMed
    1. Kurokawa M, Kornbluth S. Caspases and kinases in a death grip. Cell. 2009;138:838–854. - PMC - PubMed
    1. Krumschnabel G, Sohm B, Bock F, Manzl C, Villunger A. The enigma of caspase-2: the laymen's view. Cell Death Diff. 2009;16:195–207. - PMC - PubMed
    1. Tinel A, Tschopp J. The PIDDosome, a protein complex implicated in activation of caspase-2 in response to genotoxic stress. Science. 2004;304:843–846. - PubMed
    1. Sidi S, Sanda T, Kennedy RD, Hagen AT, Jette CA, Hoffmans R, et al. Chk1 suppresses a caspase-2 apoptotic response to DNA damage that bypasses p53, Bcl-2, and caspase-3. Cell. 2008;133:864–877. - PMC - PubMed

Publication types

MeSH terms

Substances