. 2012 Jun 29;31(13):2869-81.
doi: 10.1038/emboj.2012.134. Epub 2012 May 11.

The KDEL receptor couples to Gαq/11 to activate Src kinases and regulate transport through the Golgi

Affiliations

The KDEL receptor couples to Gαq/11 to activate Src kinases and regulate transport through the Golgi

Monica Giannotta et al. EMBO J. .

Abstract

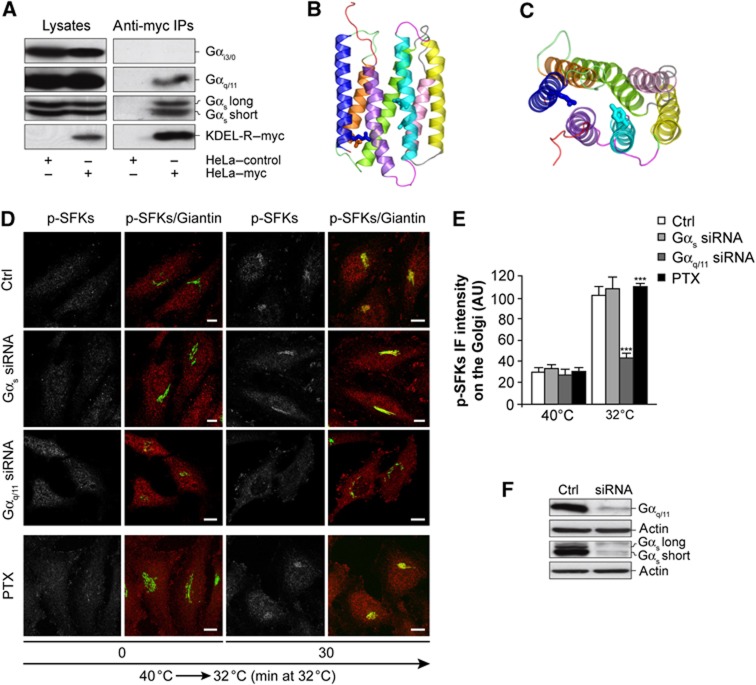
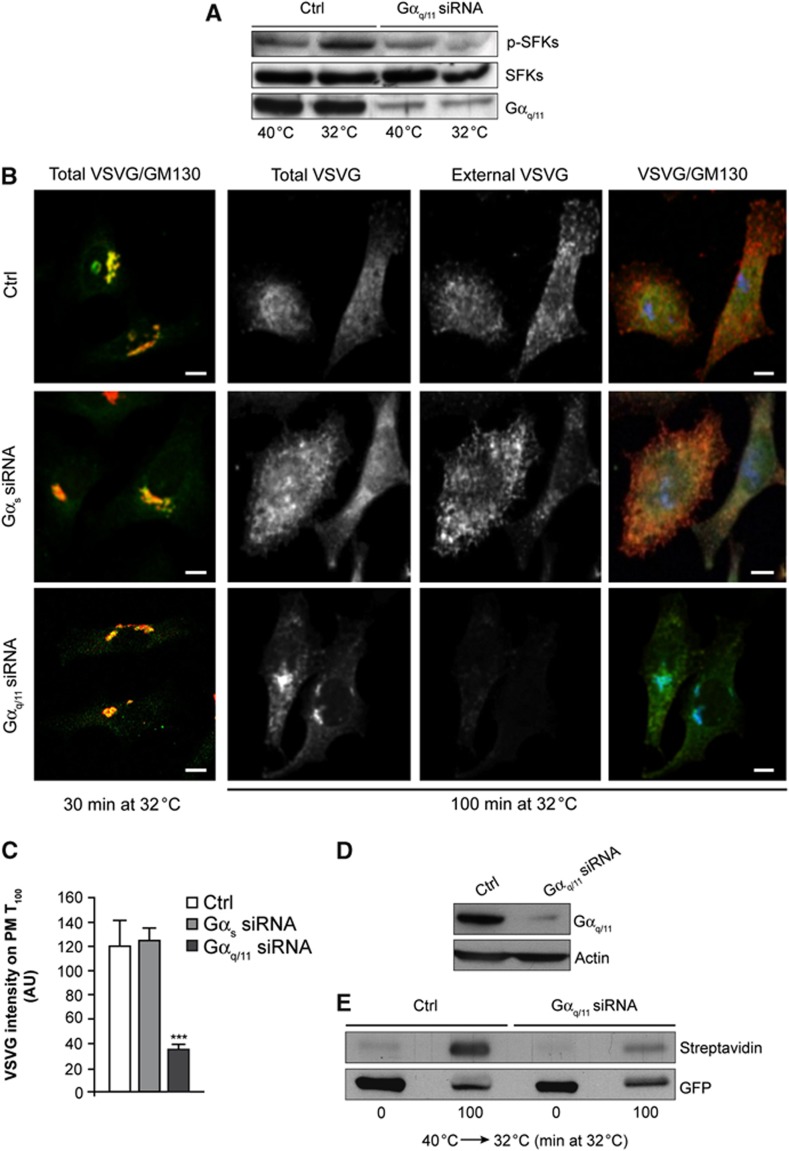
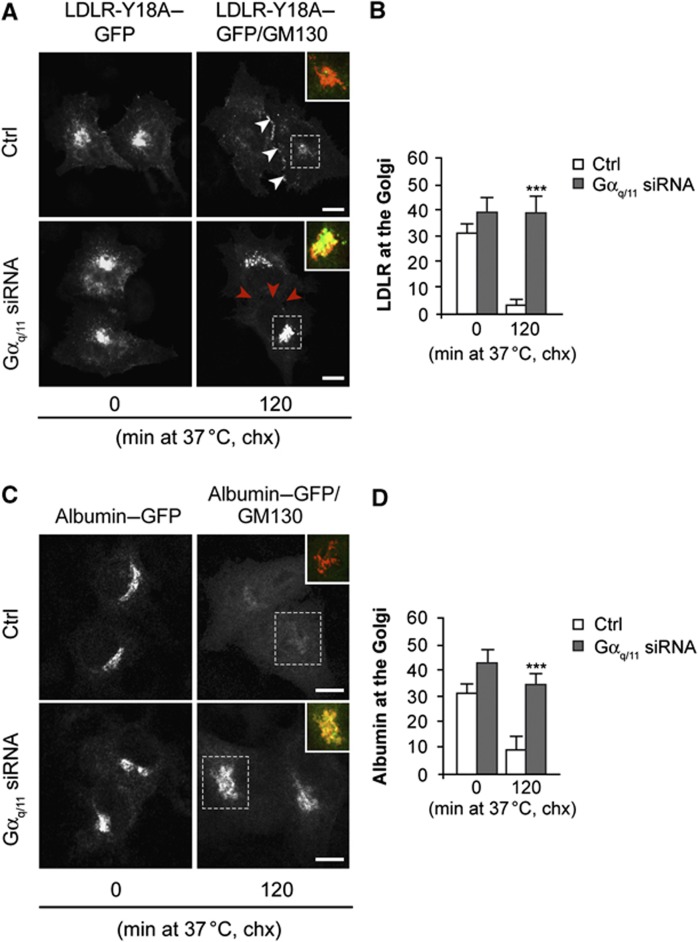
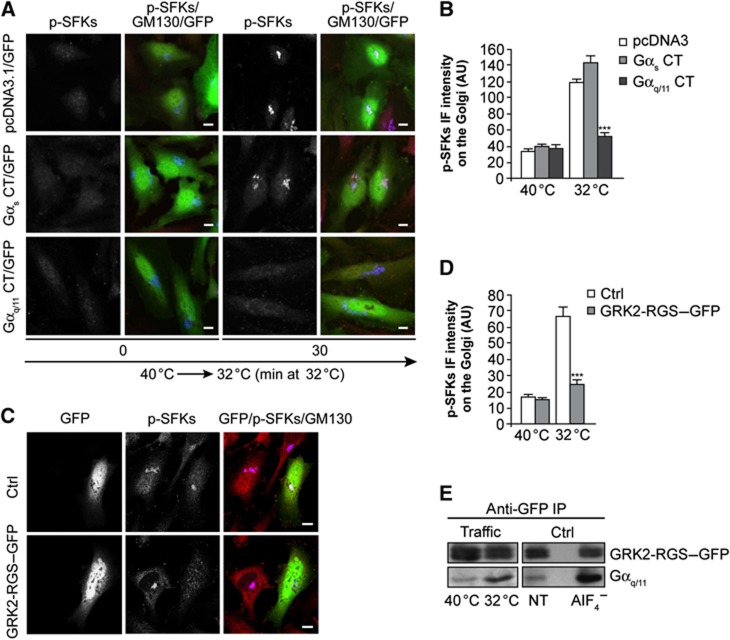
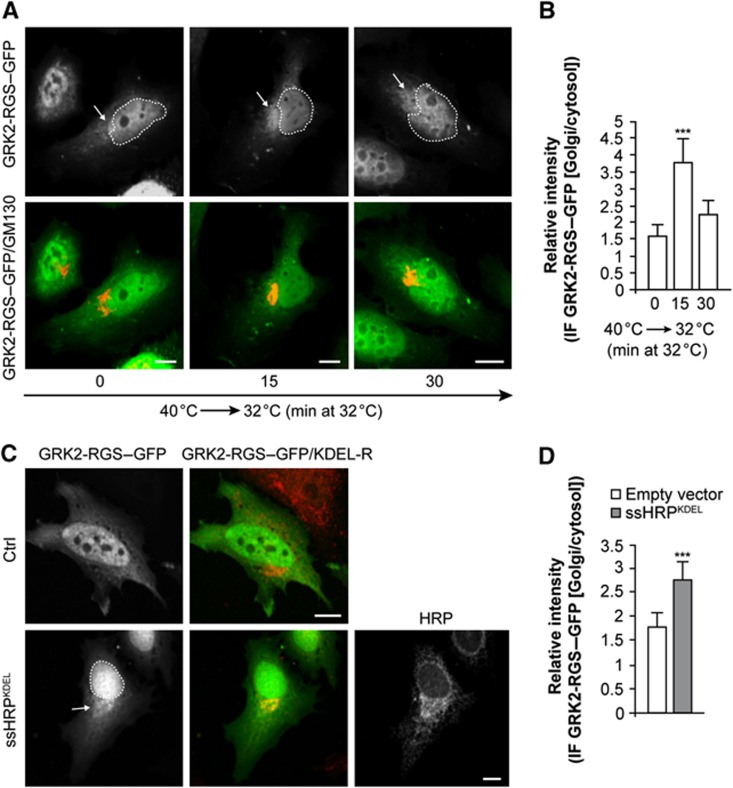
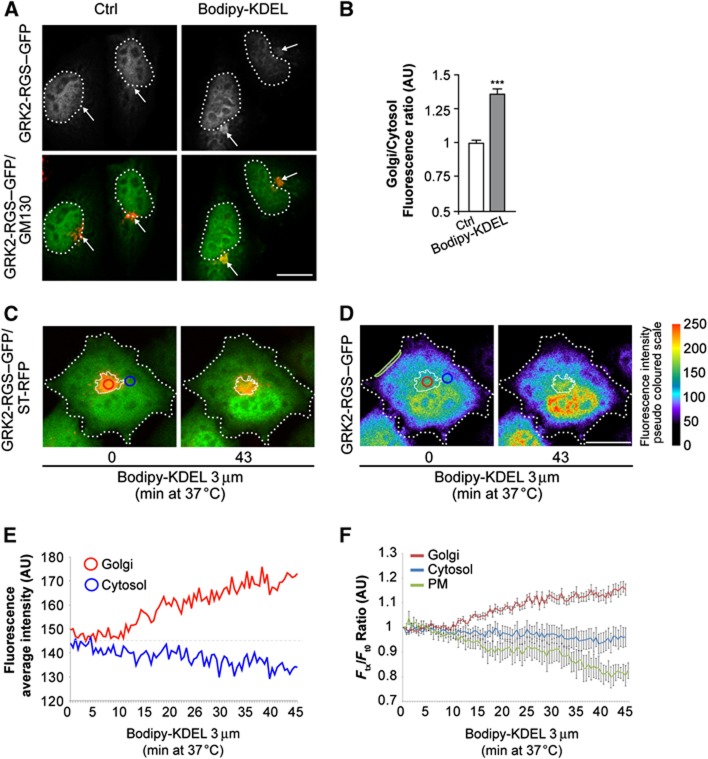
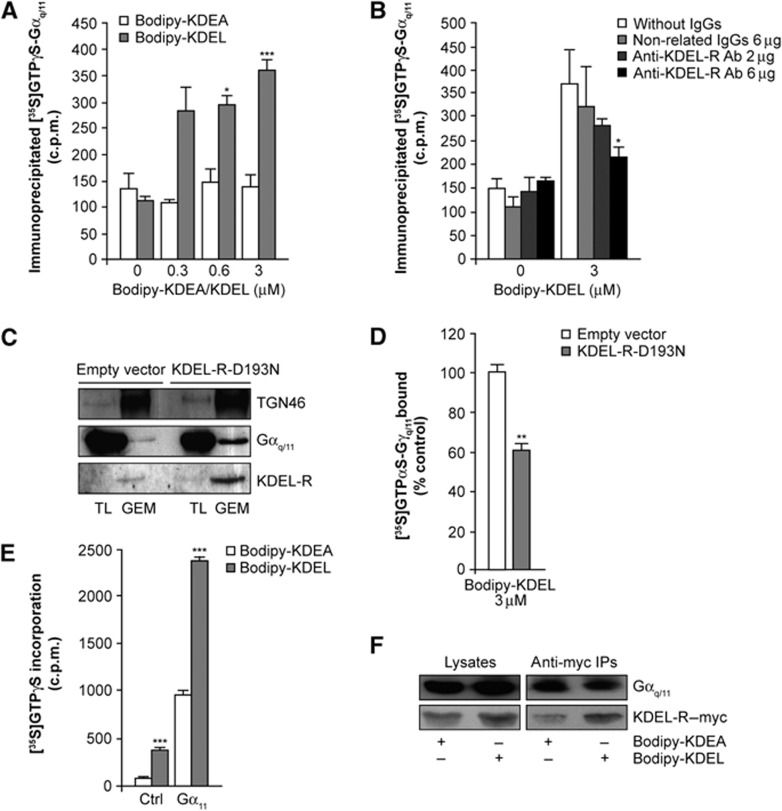
Membrane trafficking involves large fluxes of cargo and membrane across separate compartments. These fluxes must be regulated by control systems to maintain homoeostasis. While control systems for other key functions such as protein folding or the cell cycle are well known, the mechanisms that control secretory transport are poorly understood. We have previously described a signalling circuit operating at the Golgi complex that regulates intra-Golgi trafficking and is initiated by the KDEL receptor (KDEL-R), a protein previously known to mediate protein recycling from the Golgi to the endoplasmic reticulum (ER). Here, we investigated the KDEL-R signalling mechanism. We show that the KDEL-R is predicted to fold like a G-protein-coupled receptor (GPCR), and that it binds and activates the heterotrimeric signalling G-protein Gα(q/11) which, in turn, regulates transport through the Golgi complex. These findings reveal an unexpected GPCR-like mode of action of the KDEL-R and shed light on a core molecular control mechanism of intra-Golgi traffic.


Conflict of interest statement

The authors declare that they have no conflict of interest.

Figures

Figure 1
Figure 1
The KDEL-R shares similarities with GPCRs and activates SFKs through Gαq/11. (A) Gαq/11 and Gαs coimmunoprecipitate with KDEL-R–myc from HeLa cells. The protein extracts (lysates) from wild-type HeLa (HeLa-control) and HeLa cells stably transfected with KDEL-R–myc (HeLa–myc) were immunoprecipitated with an anti-myc antibody. These lysates and the immunoprecipitates (anti-myc IPs) were analysed by western blotting using an anti-myc antibody (KDEL-R–myc) and antibodies against different Gα classes, as indicated. (B) Cartoon representation of the structural model of the KDEL-R seen in a direction parallel to the membrane surface, with the intracellular side at the top. Helices 1, 2, 3, 4, 5, 6, and 7 are shown in blue, orange, green, pink, yellow, cyan, and violet, respectively. The N-terminal and C-terminal are red, intracellular loop 1 (IL1) and extracellular loop 2 (EL2) are lime, IL2 and EL2 are grey, and IL3 and EL3 are magenta. The side chains of the putative binding site amino acids (i.e., R5, D50, Y162, and N165; Scheel and Pelham, 1998) are shown as sticks; it can be seen that they are directed towards the core of the seven-helix bundle. (C) Cartoon representation of the structural model of the KDEL-R seen from the intracellular side, in a direction perpendicular to the membrane surface. (D) Depletion of Gαq/11 inhibits traffic-pulse-dependent SFKs activation at the Golgi complex. HeLa cells were treated with non-targeting siRNAs (Ctrl), siRNAs against Gαq/11 and Gαs (Gαq/11, Gαs siRNA) for 72 h, or 400 ng/ml PTX for 16 h. After infection with VSV for 45 min, the cells were incubated at 40°C for 3 h (temperature block) and then shifted to 32°C for 30 min (block release). Control cells and siRNAs-treated cells were fixed and stained for active SFKs (p-SFKs, grey scale) and giantin (marker for Golgi area definition). Merged images following the temperature-block release are shown (p-SFKs/Giantin; red and green respectively). Scale bars, 10 μm. (E) Quantification of data illustrated in (D). The p-SFKs IF intensities at the Golgi complex are expressed as arbitrary units (AU). Data are mean values (±s.d.) from four independent experiments. ***P<0.001 compared with 32°C control (ANOVA analysis). (F) Western blotting reveals decreases in Gαq/11 and Gαs levels in siRNA-treated cells, compared with control cells. HeLa cells were treated with non-targeting siRNAs (Ctrl) and siRNAs against Gαq/11 and Gαs (siRNA) for 72 h, and then homogenized. The cell lysates were analysed by immunoblotting for the different Gα subunits, with actin as the loading control.
Figure 2
Figure 2
Depletion of Gαq/11 inhibits traffic-pulse-dependent SFKs activation and arrival of VSVG at the PM. (A) HeLa cells were treated with non-targeting siRNAs and siRNAs against Gαq/11 for 72 h. After infection with VSV for 45 min, the cells were incubated at 40°C for 3 h (temperature block), shifted to 32°C for 30 min (temperature-block release) and homogenized. Control cells (Ctrl) and siRNA-treated cells (Gαq/11 siRNA) were analysed by immunoblotting for total SFKs, the phosphorylated active forms of the SFKs (p-SFKs) and the Gαq/11 silencing efficiency. (B) HeLa cells were treated with non-targeting siRNAs (Ctrl, upper panels), and with siRNAs against Gαs (Gαs siRNA, middle panels) and Gαq/11 (Gαq/11 siRNA, lower panels) for 72 h. After infection with VSV for 45 min, the cells were incubated at 40°C for 3 h (temperature block) and then shifted to 32°C for the indicated times (temperature-block release). Panels 30 min: control cells (Ctrl) and siRNAs-treated (Gαs siRNA and Gαq/11 siRNA, respectively) were fixed and stained for VSVG (green) and GM130 (marker for Golgi area definition, red). Merged images of red and green signals are shown (Total VSVG/GM130). Panels 100 min: immunostaining for total VSVG (grey scale), VSVG at the PM (revealed by an antibody against the extracellular domain of VSVG; External VSVG, grey scale) and GM130. Merged images of total VSVG (green), external VSVG (red) and GM130 (blue) signals are shown (VSVG/GM130). Scale bars, 10 μm. (C) Quantification of data illustrated in (B). VSVG IF intensities at the PM were calculated as the ratio of VSVG on the PM to the total VSVG, and expressed as AU. Data are mean values (±s.d.) from three independent experiments. ***P<0.001 compared with control (ANOVA analysis). (D) Western blotting reveals decrease in Gαq/11 levels in siRNA-treated cells. HeLa cells were treated with non-targeting siRNAs (Ctrl) and Gαq/11 siRNAs for 72 h. The cells lysates were analysed by immunoblotting for Gαq/11, with actin as the loading control. (E) Biotinylation analysis of the VSVG at the PM. HeLa cells were treated as in (D) for 56 h, transfected with VSVG–GFP, incubated at 40°C for 16 h and then shifted to 32°C for 100 min. Surface proteins were labelled with biotin, VSVG–GFP was immunoprecipitated with an anti-GFP antibody and separated by gel electrophoresis. The biotinylated VSVG–GFP was detected by peroxidase-conjugated streptavidin. As a control, total immunoprecipitated VSVG–GFP was detected by an anti-GFP antibody. The data are a representative experiment, which was performed three times.
Figure 3
Figure 3
Depletion of Gαq/11 inhibits the arrival of LDL receptor at the PM and the secretion of albumin. (A) HeLa cells were treated as in Figure 2A, the last 16 h were transfected with the endocytosis-defective GFP-tagged LDL receptor (LDLR-Y18A–GFP). Cells were then incubated for 2 h with cycloheximide (chx) at 37°C to inhibit protein synthesis, fixed and labelled with GM130 (marker for Golgi area definition, red). Single channel (LDLR-Y18A–GFP) in grey scale and coloured merged signals in the insets (LDLR-Y18A–GFP/GM130), are shown. White (Ctrl panel) and red (Gαq/11 siRNA) arrowheads indicate the LDLR-Y18A at the PM. Scale bars, 10 μm. (B) Quantification of data illustrated in (A). Data are mean values (±s.d.) from three independent experiments. ***P<0.001 compared with control at 120 min (Student’s t-test). (C) HeLa cells were treated as in (A), the last 16 h were transfected with albumin–GFP. Cells were then incubated for 2 h with cycloheximide (chx) at 37°C to inhibit protein synthesis, fixed and labelled with GM130 (marker for Golgi are definition, red). Single channel (Albumin–GFP) in grey scale and coloured merged signals in the insets (Albumin–GFP/GM130) are shown. Scale bars, 10 μm. (D) Quantification of data illustrated in (C). Data are mean values (±s.d.) from three independent experiments. ***P<0.001 compared with control at 120 min (Student’s t-test).
Figure 4
Figure 4
q/11 is required for the traffic-pulse-dependent Golgi-SFKs activation. (A) Traffic-pulse-dependent Golgi-SFKs activation is prevented by the Gαq/11 subunit C-terminal peptide. HeLa cells were cotransfected with GFP and the pcDNA3.1 vector as control, (pcDNA3.1/GFP) and with the C-terminal minigene vectors (GαsCT/GFP, Gαq/11CT/GFP). The cells were then incubated at 40°C for 3 h (temperature block, resulting in procollagen IV accumulation in the ER), and then shifted to 32°C for 30 min (temperature-block release), and fixed and stained for active SFKs (p-SFKs, grey scale) and GM130 (marker for Golgi area definition). Merged images are shown (p-SFKs/GM130/GFP; red, blue and green respectively). Scale bars, 10 μm. (B) Quantification of data illustrated in (A). The p-SFKs IF intensities at the Golgi complex are expressed as AU. Data are mean values (±s.d.) from four independent experiments. ***P<0.001 compared with 32°C control (ANOVA analysis). (C) Traffic-pulse-dependent Golgi-SFKs activation requires GTP-loaded Gαq/11. HeLa cells were transfected with GFP (Ctrl) or GRK2-RGS–GFP-tagged constructs (GRK2-RGS–GFP). After 24 h, the cells were treated as in (A), fixed and stained for GM130 and active SFKs (p-SFKs, grey scale). Merged images are shown (GFP/p-SFKs/GM130; green, red and blue respectively). Scale bars, 10 μm. (D) Quantification of the effects of GRK2-RGS–GFP transfection on p-SFKs in the Golgi area. The p-SFKs IF intensities at the Golgi complex are expressed as AU. Data are mean values (±s.d.) from three independent experiments. ***P<0.001 compared with 32°C control (ANOVA analysis). (E) The interaction of GRK2-RGS–GFP with Gαq/11 increases in response to traffic-induced KDEL-R stimulation. HeLa cells were transfected with GRK2-RGS–GFP and after 48 h they were treated as in (A), and then homogenized either during the temperature block or 30 min after the temperature-block release (Traffic). The protein extracts were immunoprecipitated with an anti-GFP antibody and the immunoprecipitates (anti-GFP IP) were analysed by western blotting using an anti-GFP antibody (GRK2-RGS–GFP) and antibodies against Gαq/11. As a positive control (Ctrl), the cells were treated with AlF4- and processed as above. NT stands for untreated.
Figure 5
Figure 5
q/11 is activated at the Golgi complex by traffic and KDEL-R stimulation. (A) GRK2-RGS–GFP is recruited to the Golgi complex in response to traffic-induced KDEL-R stimulation. HeLa cells were transfected with GRK2-RGS–GFP and after 24 h the cells were incubated at 40°C for 3 h (temperature block, resulting in procollagen IV accumulation in the ER), then shifted to 32°C for the indicated times (temperature-block release) and fixed. The cells were stained for GM130 (marker for Golgi area definition). Merged images of GRK2-RGS-GFP (green) and GM130 (red) signals are shown (bottom panels). Scale bars, 10 μm. (B) Quantification of recruitment of GRK2-RGS–GFP to the Golgi complex, as the ratio of its Golgi to cytosol IF. Data are mean values (±s.d.) from three independent experiments. ***P<0.001 compared with time 0 (ANOVA analysis). (C) GRK2-RGS–GFP is recruited to the Golgi complex in response to ssHRPKDEL-induced KDEL-R stimulation. HeLa cells were cotransfected with GRK2-RGS–GFP and an empty vector (Ctrl, upper panels) or ssHRPKDEL (lower panels), fixed and stained for the KDEL-R (marker for Golgi area definition) and HRP (right panel, grey scale). Merged images of GRK2-RGS-GFP (green) and KDEL-R (red) signals are shown (GRK2-RGS–GFP/KDEL-R, middle panels). Scale bars, 10 μm. (D) Quantification of the recruitment of GRK2-RGS–GFP to the Golgi complex, as the ratio of Golgi to cytosol IF. Data are mean values (±s.d.) from three independent experiments. ***P<0.001 compared with empty vector (Student’s t-test).
Figure 6
Figure 6
q/11 is activated at the Golgi complex upon ligand binding to the KDEL-R. (A) HeLa cells were transfected with GRK2-RGS–GFP and after 24 h the cells were treated for 30 min with vehicle (Ctrl) or 3 μM Bodipy-KDEL, fixed and labelled with GM130, (marker for Golgi area definition). Arrows indicate the Golgi area. Single channel (GRK2-RGS–GFP) in grey scale and coloured merged signals are shown (GRK2-RGS–GFP/GM130; green and red respectively). Scale bars, 10 μm. (B) Quantification of data illustrated in (A). Data are mean values (±s.e.) from three independent experiments. ***P<0.001 compared with control (Student’s t-test). (C) HeLa cells were cotransfected with GRK2-RGS–GFP and Sialyltransferase-RFP (ST-RFP) as Golgi marker, 24 h later the cells were treated with 3 μM Bodipy-KDEL for the indicated time. The cells were recorded by live-cell imaging. The average GRK2-RGS–GFP fluorescence was measured on Golgi area (red circle) using ST-RFP as reference and cytosol (blue circle). The merged signals is shown. (D) The GRK2-RGS–GFP fluorescence of the experiment in (C) is shown in pseudocolour. Scale bars, 10 μm. (E) Quantitative fluorescence of Golgi area and cytosol of the experiment shown in (C). (F) Quantitative average fluorescence of Golgi area, cytosol and PM (green ellipse) of cells treated as in (C). The graph shows the ratio between fluorescence at time 0 (Ft0) and fluorescence at the different times (Ftx). Data are mean values (±s.e.) of 12 cells from two independent experiments.
Figure 7
Figure 7
Direct KDEL-R stimulation triggers the loading of [35S]GTPγS into Gαq/11. (A) Bodipy-KDEL induces the stimulation of [35S]GTPγS binding to Gαq/11 in a dose-dependent manner. Golgi-enriched membranes from rat liver were incubated with [35S]GTPγS in the presence of increasing concentrations of the membrane-permeant KDEL-R agonist Bodipy-KDEL (dark bars) or Bodipy-KDEA (white bars) as control. After 5 min at 30°C, the membranes were collected and solubilised, Gαq/11 was immunoprecipitated, and the Gαq/11-associated radioactivity was measured. The data are mean values±s.d. of triplicate determinations, performed three times. *P<0.05 and ***P<0.001, Bodipy-KDEL compared with Bodipy-KDEA at the given concentration. (B) An anti-KDEL-R antibody impairs [35S]GTPγS binding to Gαq/11. Golgi-enriched membranes from rat liver were incubated with [35S]GTPγS in the presence of the membrane-permeant KDEL-R agonist Bodipy-KDEL (3 μM). Two hours after addition of non-related IgGs (non-related IgGs) or a KDEL-R antibody (anti-KDEL-R Ab) at 4°C, the membranes were treated as in (A), collected and solubilised, and Gαq/11 was immunoprecipitated and the Gαq/11-associated radioactivity was measured. The data are mean values±s.d. of triplicate determinations from a single representative experiment, which was performed three times. *P<0.05, Anti-KDEL-R Ab compared with non-related IgGs. (C) Golgi-enriched membranes from transfected HeLa cells. Total lysate (TL) and Golgi-enriched membranes (GEM) from mock-transfected (empty vector) or KDEL-R-mutant-transfected (KDEL-R-D193N) HeLa cells were solubilised and analysed by immunoblotting for TGN46, Gαq/11 and the KDEL-R. (D) The KDEL-R mutant D193N impairs [35S]GTPγS binding to Gαq/11. Golgi-enriched membranes from mock-transfected (empty vector) or KDEL-R-mutant-transfected (KDEL-R-D193N) HeLa cells were incubated with [35S]GTPγS in the presence of Bodipy-KDEL and treated as in (A). The data are mean values±s.d. of triplicate determinations, each performed three times. **P<0.01, KDEL-R-D193N compared with empty vector. (E) HeLa cells stably expressing KDEL-R–myc were transfected with Gα11 or pcDNA3.1 vector as control (Ctrl). After 24 h, the KDEL-R–myc was immunoprecipitated with an anti-myc antibody. The immunoprecipitated proteins, associated to the agarose beads, were incubated with [35S]GTPγS in the presence of the KDEL-R agonist Bodipy-KDEL (3 μM) (dark bars) or the control peptide Bodipy-KDEA (3 μM) (white bars). After 10 min at 30°C, the immunoprecipitate was washed, and the radioactivity associated was measured. The data are mean values±s.d. of triplicate determinations from a single representative experiment, which was performed three times. ***P<0.001, Ctrl Bodipy-KDEL compared with Ctrl Bodipy-KDEA; ***P<0.001, Gα11 Bodipy-KDEL compared with Gα11 Bodipy-KDEA; ***P<0.001, Gα11 Bodipy-KDEL compared with Ctrl Bodipy-KDEL (ANOVA analysis). (F) HeLa cells stably expressing KDEL-R–myc were transfected with Gα11 vector. After 48 h, cells were treated with the membrane-permeant KDEL-R agonist Bodipy-KDEL (3 μM) or the control peptide Bodipy-KDEA (3 μM) at 37°C for 1 h. The cells were lysed (lysates), immunoprecipitated with anti-myc antibody (anti-myc IPs) and analysed by western blotting using an anti-myc antibody (KDEL-R–myc) and an anti-Gαq/11 antibody. Note that lysates and anti-myc immuoprecipitated bands display similar intensities because their autoradiography films have been exposed differently. The data are a representative experiment, which was performed twice.

Similar articles

Cited by

References

    1. Akam EC, Challiss RA, Nahorski SR (2001) G(q/11) and G(i/o) activation profiles in CHO cells expressing human muscarinic acetylcholine receptors: dependence on agonist as well as receptor-subtype. Br J Pharmacol 132: 950–958 - PMC - PubMed
    1. Alberts B, Johnson A, Lewis J, Raff M, Roberts KPW (2002) Molecular Biology of the Cell 4th ednNew York: Garland Science
    1. Balch WE, Dunphy WG, Braell WA, Rothman JE (1984) Reconstitution of the transport of protein between successive compartments of the Golgi measured by the coupled incorporation of N-acetylglucosamine. Cell 39: 2 Part 1405–416 - PubMed
    1. Berman DM, Kozasa T, Gilman AG (1996) The GTPase-activating protein RGS4 stabilizes the transition state for nucleotide hydrolysis. J Biol Chem 271: 27209–27212 - PubMed
    1. Bonazzi M, Spano S, Turacchio G, Cericola C, Valente C, Colanzi A, Kweon HS, Hsu VW, Polishchuck EV, Polishchuck RS, Sallese M, Pulvirenti T, Corda D, Luini A (2005) CtBP3/BARS drives membrane fission in dynamin-independent transport pathways. Nat Cell Biol 7: 570–580 - PubMed

Publication types

MeSH terms

LinkOut - more resources