. 2012 May 11;149(4):780-94.
doi: 10.1016/j.cell.2012.03.031.

Sequential application of anticancer drugs enhances cell death by rewiring apoptotic signaling networks

Affiliations

Sequential application of anticancer drugs enhances cell death by rewiring apoptotic signaling networks

Michael J Lee et al. Cell. .

Abstract

Crosstalk and complexity within signaling pathways and their perturbation by oncogenes limit component-by-component approaches to understanding human disease. Network analysis of how normal and oncogenic signaling can be rewired by drugs may provide opportunities to target tumors with high specificity and efficacy. Using targeted inhibition of oncogenic signaling pathways, combined with DNA-damaging chemotherapy, we report that time-staggered EGFR inhibition, but not simultaneous coadministration, dramatically sensitizes a subset of triple-negative breast cancer cells to genotoxic drugs. Systems-level analysis-using high-density time-dependent measurements of signaling networks, gene expression profiles, and cell phenotypic responses in combination with mathematical modeling-revealed an approach for altering the intrinsic state of the cell through dynamic rewiring of oncogenic signaling pathways. This process converts these cells to a less tumorigenic state that is more susceptible to DNA damage-induced cell death by reactivation of an extrinsic apoptotic pathway whose function is suppressed in the oncogene-addicted state.


Figures

Figure 1
Figure 1. A screen for novel combination treatment reveals dosing schedule-dependent efficacy for killing TNBC cells
(A) Schematic of combinations tested. 7 genotoxic drugs and 8 targeted signaling inhibitors were tested in pair-wise combinations, varying dose, order of presentation, dose duration, and dosing schedule. (B) Apoptosis in BT-20 cells. Cleaved-caspase 3/cleaved-PARP double positive cells were quantified using flow cytometry (bottom panels). In cells treated with DMSO, erlotinib (ERL) or doxorubicin (DOX), apoptosis measurements were performed 8 hrs. after drug exposure or at the indicated times. D/E, ERL→DOX, and DOX→ERL refer to DOX and ERL added at the same time, ERL given at the indicated times before DOX, and DOX given at the indicated times before ERL, respectively. For each, apoptotic measurements were made 8 hrs after the addition of DOX. Erlotinib and doxorubicin were used at 10µM. Mean values ± S.D. of 3 independent experiments, each performed in duplicate, are shown (top panel). (C–F) Apoptosis in different subtypes of breast cancer. Apoptosis was measured as in B. D/E, E→D, and D→E refer to DOX and ERL added at the same time, ERL given 24 hours before DOX, and DOX given 4 hours before ERL, respectively. Data are mean values ± S.D. of 3 independent experiments. (G) Dose-response profiles of erlotinib/doxorubicin drug combinations. Apoptosis was measured as in B. Drugs were added at a 1:1 ratio, and combination index (CI) was calculated according to the Chou-Talalay method. (H) Knockdown of EGFR in BT-20 cells measured 48 hrs. after addition of the indicated siRNA by immunoblotting (left). EGFR expression relative to “no RNA” control is quantified on right. (I) Apoptosis in BT-20 cells +/− EGFR knockdown measured as in B. Scrambled RNAi shown as control. Data shown are the mean ± S.D. of both siRNAs, each performed in biological duplicate.
Figure 2
Figure 2. Prolonged treatment with erlotinib does not change cell cycle profile, doxorubicin influx/efflux, or the level of DNA damage
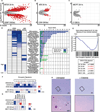
(A–D) Quantitative cell cycle analysis. DNA content and the percentage of mitotic cells were measured by FACS. (A) Example FACS plots from untreated BT-20 cells. (B–D) Cell cycle stage quantified from 3 experiments, each performed in duplicate. Cells were treated as in Figure 1, and data were collected at 6, 8, 12, 24, and 48 hours after DOX treatment. 8 hour data shown for each cell type. (E–H) Doxorubicin retention measured by flow cytometry. (E) Sample time course of BT-20 cells treated with 10µM DOX for the indicated times. (F–H) Cells treated with doxorubicin (DOX) or pre-treated with erlotinib for 24 hrs. prior to DOX (E→D). Cells were collected at 1, 4, or 8 hours after DOX exposure as indicated, and internal doxorubicin fluorescence was measured. (I–J) Quantitative microscopy of the early DNA double stranded break response. (I) Example image of cells treated with DOX for 1 hour and stained for γH2AX, 53BP1, or nuclear content (DAPI). (J) Integrated intensity per nucleus of γH2AX and 53BP1 foci was measured in BT-20 cells after the indicated treatments and times. Mean values +/− S.D. from triplicate experiments shown. (K) Western blot analysis of γH2AX in BT-20 cells. β-actin shown as a loading control.
Figure 3
Figure 3. Triple-negative BT-20 cells are driven by oncogenic EGFR signaling
(A–C) Differentially expressed genes (DEGs) following erlotinib treatment for 24 hrs vs. untreated cells. Cut-off for DEG was ≥2-fold change and a p-value ≤0.05 (genes that meet both criteria are colored red). B score is the log of the odds of differential expression. (D) DEGs classified using GeneGO “pathway maps”. Heatmap (left) colored according to –log (p-value); (right) p-value cut-off was 0.05 (dotted red line). (E and F) Microarray analysis using GSEA reveals loss of oncogene signatures in BT-20 cells after sustained EGFR inhibition. RAS Oncogenic Signature and false discovery rate (FDR) adjusted p-values shown in E. 11 oncogenic signatures from msigdb shown in F. Boxes are colored according to normalized enrichment score (NES). (G) GSEA reveals a switch from Basal to Luminal A genetic signature in BT-20 cells following sustained EGFR inhibition. Expression analyzed as in F using breast cancer subtype-specific genetic signatures as defined by Sorlie et al. (H) BT-20 cells lose the ability to form colonies in soft agar upon EGFR inhibition. Cells were untreated or treated with ERL, grown in soft agar, and monitored for colony formation 21 days later.
Figure 4
Figure 4. A systems level signal-response dataset collected using a variety of high-throughput techniques
(A–D) (A) The complete signaling dataset for 3 different breast cancer sub-types following combined EGFR inhibition and genotoxic chemotherapy treatments as in Figure 1. Each box represents an 8- or 12-point time course of biological triplicate experiments. Time course plots are colored by response profile, with early sustained increases in signal colored green, late sustained increases colored red, and transient increases colored yellow. Decreases in signal are colored blue. Signals that are not significantly changed by treatment are shaded grey to black with darkness reflecting signal strength. Numbers to the right of each plot report fold-change across all conditions/cells. (B) Sample detailed signaling time course from panel A, highlighted by dashed box and asterisk, showing p-ERK activation in BT-20cells. Mean values ± S.D. of 3 experiments shown. (C) 48-sample Western blots analyzed using 2-color infrared detection. Each gel contained an antibody-specific positive control (P) for blot-toblot normalization. The example shown is one of three gels for total p53 in MCF7 cells (p53 in green; β-actin in red). (D) Reverse phase protein lysate microarrays were used to analyze targets of interest when array-compatible antibodies were available. The slide shown contains ~2,500 lysate spots (experimental and technical triplicates of all of our experimental samples, and control samples used for antibody calibration), probed for phospho-S6. (E) The complete cellular response dataset, colored as in A.
Figure 5
Figure 5. A PLS model accurately predicts phenotypic responses from time-resolved molecular signals
(A) Principal components analysis of co-variation between signals. Scores plot represents an aggregate measure of the signaling response for each cell type under each treatment condition at a specified time, as indicated by the colors and symbols in the legend. (B and C) Scores and loadings for a PLS model. (B) Scores calculated and plotted as in panel A, except the principal components now reflect co-variation between signals and responses. (C) PLS loadings plotted for specific signals and responses projected into principal component space. (D–M) BT-20 cell line-specific model calibration. (D) R2, Q2, and RMSE for BT-20 models built with increasing numbers of principal components. (E, F) Scores and loadings plots, respectively, for a 2 component model of BT-20 cells. (G–I) Apoptosis as measured by flow cytometry, or as predicted by our model using jack-knife cross-validation. R2 reports model fit, and Q2 reports model prediction accuracy. (G) Final refined model of apoptosis in BT-20. (H) BT-20 model minus targets identified as DEGs in microarray analysis. (I) Model using only the top 4 signals: c-caspase-8, c-caspase-6, p-DAPK1, and pH2AX.
Figure 6
Figure 6. Enhanced sensitivity to doxorubicin is mediated by caspase-8 activation
(A) VIP scores for predicting apoptosis plotted for each cell line specific PLS model. VIP score >1 indicates important x variables that predict y responses, while signals with VIP scores < 0.5 indicate unimportant x variables. (B, C) Model-generated predictions of apoptosis with (blue) or without (red) caspase-8 activation 8 hrs. after the indicated treatments in BT-20 (B) and 453 (C). (D, E) Western blot verifying caspase-8 knockdown in BT-20 (D) and453 (E). (F, G) Measured apoptosis 8 hrs. after the indicated treatment in cells expressing control RNA or caspase-8 siRNA. (F) BT-20. (G) 453. In both (F) and (G) apoptotic values represent mean response ± S.D. from both siRNAs, each in duplicate.
Figure 7
Figure 7. Time-staggered inhibition of EGFR signaling enhances apoptotic response in a subset of TNBC cells and other EGFR driven cells
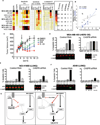
(A) Panel of TNBC cell lines with a wide range of EGFR expression levels. Heatmap for total EGFR expression, p-EGFR (Y1173), percent apoptosis, apoptosis relative to DOX alone, and casp-8 cleavage. Apoptosis measured as in Figure 1. EGFR and p-EGFR expression measured by Western blotting of untreated cells. Cleaved casp-8 measured by Western blot 8 hrs. after exposure to DOX. (B) EGFR activity—but not total EGFR expression—is correlated with sensitivity to time-staggered ERL→DOX combination. Fold enrichment of cell death observed in E→D relative to DOX alone regressed against total EGFR or p-EGFR (pY1173) as measured in untreated cells for the 10 TNBC cell lines shown in Figure 7A. R2 reports the linear fit for each trend line. (C) BT-20 cells grown as xenograft tumors in nude mice. Arrow indicates intraperitoneal administration of indicated drugs. Mean tumor volume ± SEM shown from 4 animals for each treatment condition. (D–F) Time-staggered inhibition of HER2 in HER2 driven breast cancer cells (D) or EGFR in lung cancer cells (E–F) causes casp-8 activation and sensitization to DOX. Apoptosis measured as in Figure 1 for cells exposed to a control RNA (left in each panel) or siRNA targeting casp-8 (right in each panel). Caspase-8 activation was monitored 8 hrs. after doxorubicin treatment (c-casp8, shown beneath the Control RNA plots). Validation of caspase-8 knockdown shown below the CASP8 siRNA plots. (D) HER2 overexpressing MDA-MB-453 cells treated with lapatinib. (E–F) Lung cancer cells treated with erlotinib. (E) NCI-H1650. (F) A-549. (G) A model for enhanced cell death after DNA damage by chronic EGFR inhibition in triple-negative breast cancer cells.

Comment in

Similar articles

Cited by

References

    1. Abeloff M, Wolff A, Weber B, Zaks T, Sacchini V, McCormick B. Cancer of the breast. In: Abeloff M, Armitage J, Niederhuber J, Kastan M, McKenna W, editors. Abeloff's Clinical Oncology. Maryland Heights, MO: Churchill Livingstone; 2008.
    1. Albeck JG, Burke JM, Spencer SL, Lauffenburger DA, Sorger PK. Modeling a snap-action, variable-delay switch controlling extrinsic cell death. PLoS Biol. 2008;6:2831–2852. - PMC - PubMed
    1. Balko JM, Potti A, Saunders C, Stromberg A, Haura EB, Black EP. Gene expression patterns that predict sensitivity to epidermal growth factor receptor tyrosine kinase inhibitors in lung cancer cell lines and human lung tumors. BMC Genomics. 2006;7:289. - PMC - PubMed
    1. Bosch A, Eroles P, Zaragoza R, Vina JR, Lluch A. Triple-negative breast cancer: molecular features, pathogenesis, treatment and current lines of research. Cancer Treat Rev. 2010;36:206–215. - PubMed
    1. Carey L, Rugo H, Marcom P, Irvin W, Ferraro M, Burrows E, He X, Perou C, Winer E. TBCRC 001: EGFR inhibition with cetuximab added to carboplatin in metastatic triple-negative (basal-like) breast cancer. J Clin Oncol. 2008;26

Publication types

Associated data