. 2012 Jul 1;8(7):1071-84.
doi: 10.4161/auto.20250. Epub 2012 May 11.

Autophagy is induced through the ROS-TP53-DRAM1 pathway in response to mitochondrial protein synthesis inhibition

Affiliations

Autophagy is induced through the ROS-TP53-DRAM1 pathway in response to mitochondrial protein synthesis inhibition

Xiaolei Xie et al. Autophagy. .

Abstract

Mitoribosome in mammalian cells is responsible for synthesis of 13 mtDNA-encoded proteins, which are integral parts of four mitochondrial respiratory chain complexes (I, III, IV and V). ERAL1 is a nuclear-encoded GTPase important for the formation of the 28S small mitoribosomal subunit. Here, we demonstrate that knockdown of ERAL1 by RNA interference inhibits mitochondrial protein synthesis and promotes reactive oxygen species (ROS) generation, leading to autophagic vacuolization in HeLa cells. Cells that lack ERAL1 expression showed a significant conversion of LC3-I to LC3-II and an enhanced accumulation of autophagic vacuoles carrying the LC3 marker, all of which were blocked by the autophagy inhibitor 3-MA as well as by the ROS scavenger NAC. Inhibition of mitochondrial protein synthesis either by ERAL1 siRNA or chloramphenicol (CAP), a specific inhibitor of mitoribosomes, induced autophagy in HTC-116 TP53 (+/+) cells, but not in HTC-116 TP53 (-/-) cells, indicating that tumor protein 53 (TP53) is essential for the autophagy induction. The ROS elevation resulting from mitochondrial protein synthesis inhibition induced TP53 expression at transcriptional levels by enhancing TP53 promoter activity, and increased TP53 protein stability by suppressing TP53 ubiquitination through MAPK14/p38 MAPK-mediated TP53 phosphorylation. Upregulation of TP53 and its downstream target gene DRAM1, but not CDKN1A/p21, was required for the autophagy induction in ERAL1 siRNA or CAP-treated cells. Altogether, these data indicate that autophagy is induced through the ROS-TP53-DRAM1 pathway in response to mitochondrial protein synthesis inhibition.

Keywords: DRAM1; ERAL1; ROS; TP53; autophagy; chloramphenicol; mitoribosome.


Figures

None
Figure 1. Autophagy is induced by ERAL1 knockdown in HeLa cells. (A) Electron microscopy pictures were taken of HeLa cells with stable expression of ERAL1-shRNA (HeLa-shERAL1) or scramble shRNA (HeLa-shNC). Arrows represent autophagic vacuoles. (B) LC3-I to LC3-II conversion was induced in HeLa-shERAL1 cells. ERAL1 and LC3 in HeLa-shERAL1 and HeLa-shNC cells were detected by western blotting. (C) The LC3-I to LC3-II conversion in HeLa-shERAL1 was suppressed by Mu-ERAL1. Western blotting was performed to detect ERAL1 and LC3 in HeLa-shERAL1 cells transfected with the plasmid expressing ERAL1 from wild-type cDNA (wt-ERAL1) or from the cDNA with silent mutations in the ERAL1 shRNA targeting sequence (Mu-ERAL1). (D) ERAL1 knockdown induced apoptosis in HeLa cells when cultured in a galactose medium. HeLa-shERAL1 and HeLa-shNC cells were cultured in a glucose medium and then transferred into a galactose medium. Apoptotic cell death rates were detected before the medium change (0 h) and after being cultured in galactose medium for 48 h. The p value derived from a Student’s t-test is **p < 0.001.
None
Figure 2. The autophagy induction by ERAL1 knockdown is dependent on ROS elevation. (A) Dysfunction of mitochondrial protein synthesis in HeLa cells with ERAL1 knockdown. HeLa cells were transfected with control siRNA or ERAL1 siRNA, respectively. At 72 h post-siRNA transfection, the cells were subjected to western blotting to detect the levels of indicated mitochondrial proteins. (B) ROS levels were elevated in HeLa cells with ERAL1 knockdown. HeLa cells were transfected with control siRNA (red) or ERAL1 siRNA (blue). At 72 h post-siRNA transfection, cells were incubated with H2-DCFDA (100 μM) for 30 min and then subjected to flow cytometric analysis for quantitative estimation of ROS levels. (C and D) Autophagy was induced by ERAL1 knockdown in a ROS-dependent manner. The LC3-I to LC3-II conversion in HeLa cells (C) and GFP-LC3 puncta formation in HeLa cells transfected with GFP-LC3 plasmid (D) were detected after the cells were treated for 72 h with the siRNA(s) and inhibitor as indicated. (1) Control siRNA; (2) ERAL1 siRNA; (3) ERAL1 siRNA and NAC; (4) ERAL1 siRNA and 3-MA; (5) ERAL1 siRNA and ATG5 siRNA; (6) ERAL1 siRNA and BECN1 siRNA. The percentage of GFP-LC3 puncta-positive cells was quantified as described under Materials and Methods. Representative data were from three independent experiments. The p value derived from Student’s t-test is **p < 0.001.
None
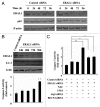
Figure 3. Autophagy suppresses the apoptosis induction in ERAL1 siRNA-treated HeLa cells. (A) SQSTM1/p62 protein levels were decreased in ERAL1 siRNA-treated HeLa cells. HeLa cells were transfected with control siRNA or ERAL1 siRNA. The levels of SQSTM1/p62 in HeLa cells were detected by western blot at the indicated time points after siRNA transfection. (B) Autophagy was induced ahead of apoptosis. The LC3-I to LC3-II conversion (top panel) and CASP3/Caspase-3 activity (bottom panel) in HeLa cells were detected at the indicated time points after ERAL1 siRNA transfection. (C) Inhibition of autophagy enhanced the CASP3 activation. HeLa cells were treated for 72 h with the siRNA(s) and inhibitor as indicated. CASP3 activities in cell lysates were determined as described under Materials and Methods. * and **, different from ERAL1 siRNA alone (column 2). The p values derived from Student’s t-test are *p < 0.01 and **p < 0.001.
None
Figure 4. Activation of the TP53-DRAM1 pathway is required for the autophagy induction by ERAL1 knockdown. (A) TP53 expression was upregulated by ERAL1 knockdown in a ROS-dependent manner. HeLa cells were transfected with ERAL1 siRNA in the presence or absence of NAC. At 72 h post-siRNA transfection, cells were subjected to western blotting to detect the TP53 protein levels. (B and C) The LC3-I to LC3-II conversion in HeLa cells (B) and GFP-LC3 puncta formation in HeLa cells transfected with a GFP-LC3 plasmid (C) were detected after the cells were treated for 72 h with the siRNA(s) as indicated. (1) control siRNA; (2) ERAL1 siRNA; (3) ERAL1 siRNA and TP53 siRNA; (4) ERAL1 siRNA and CDKN1A/p21 siRNA; (5) ERAL1 siRNA and DRAM1 siRNA. The percentage of GFP-LC3 puncta-positive cells was quantified as described under Materials and Methods. Representative data were from three independent experiments. The p value derived from Student’s t-test is **p < 0.001.
None
Figure 5. TP53 is essential for the autophagy induction by ERAL1 knockdown. (A) HCT-116 TP53+/+ and HCT-116 TP53−/− cells were transfected with ERAL1 siRNA. At 72 h post-siRNA transfection, cells were subjected to western blotting to detect the levels of the indicated proteins. (B) HCT-116 TP53+/+ and HCT-116 TP53−/− cells were transfected with GFP-LC3 plasmid and then treated with control siRNA or ERAL1 siRNA, respectively. At 72 h post-siRNA transfection, GFP-LC3 puncta formation in the cells was detected by confocal microscopy. The percentage of GFP-LC3 puncta-positive cells was quantified as described under Materials and Methods. Representative data were from three independent experiments. The p value derived from Student’s t-test is **p < 0.001.
None
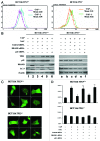
Figure 6. CAP induces autophagy through the ROS-TP53-DRAM1 pathway. (A) The ROS elevation by CAP treatment. HCT-116 TP53+/+ and HCT-116 TP53−/− cells were treated with or without CAP (50 μg/ml) for 48 h and then incubated with H2-DCFDA (100 μM) for 30 min. Cells were subjected to flow cytometric analysis for quantitative estimation of ROS levels. (B) The induction of LC3-I to LC3-II conversion by CAP treatment. HCT-116 TP53+/+ and HCT-116 TP53−/− cells were treated with CAP (50 μg/ml) in the present of NAC or after the transfection of control siRNA, DRAM1 siRNA or CDKN1A/p21 siRNA as indicated. After 48 h treatment with CAP, cells were lysed and subjected to western blotting to detect the levels of indicated proteins. (C and D) The induction of GFP-LC3 puncta formation by CAP treatment. HCT-116 TP53+/+ and HCT-116 TP53−/− cells were transfected with the GFP-LC3 plasmid and then treated with CAP (50 μg/ml) in the present of NAC or after the transfection of siRNA as indicated in (B). After 48 h treatment with CAP, cells were fixed and GFP-LC3 puncta signals were detected by confocal microscopy (C). The percentage of GFP-LC3 puncta-positive cells was quantified as described under Materials and Methods (D). Representative data were from three independent experiments. The p value derived from Student’s t-test is **p < 0.001.
None
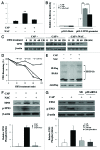
Figure 7.TP53 is activated by ROS at both transcriptional and post-translational levels in CAP-treated cells. (A) TP53 mRNA levels in CAP-treated cells. HCT-116 TP53+/+ cells were treated with CAP (50 μg/ml) for 48 h in the presence or absence of NAC. TP53 mRNA levels were analyzed by Real-Time PCR. (B) TP53 promoter activity in CAP-treated cells. HeLa cells were transfected with pGL3-Basic vector or pGL3-TP53-promoter together with a β-gal expressing plasmid, and then treated with CAP (50 μg/ml) for 48 h in the presence or absence of NAC. Luciferase activity was measured and normalized to transfection efficiency with β-galactosidase activity as internal control. (C) and (D) TP53 stability in CAP-treated cells. HCT-116 TP53+/+ cells were treated with CAP for 48 h in the absence or presence of NAC, and then incubated with CHX (20 μM). The TP53 protein levels were detected by western blotting at indicated time points after the addition of CHX (C). The densitometry analysis was performed to quantify the TP53 downregulation following CHX treatment (normalized to β-actin) (D). (E) TP53 ubiquitination in CAP-treated cells. HCT-116 TP53+/+ cells were cotransfected with HA-Ubiquitin and TP53-Flag plasmid, and then treated with CAP for 48 h in the absence or presence of NAC. Cells were treated with MG132 for 2 h, then lysed and subjected to immunoprecipitation with anti-Flag agarose beads, followed by western blotting analysis with anti-HA antibody (top panel). The same membrane was stripped and reprobed with anti-Flag antibody (bottom panel); (F) TP53 phosphorylation in CAP-treated cells. HCT-116 TP53+/+ cells were treated with CAP (50 μg/ml) for 48 h in the absence or presence of NAC and then subjected to western blotting to detect the levels of TP53 and p-TP53 (Ser15) respectively. Densitometric measurements represent relative TP53 phosphorylation as normalized against total TP53 levels (bottom panel). (G) The role of MAPK14/p38 in TP53 phosphorylation in CAP-treated cells. HCT-116 TP53+/+ cells were treated with CAP (50 μg/ml) in the presence of the MAPK14 inhibitor SB202190 (SB) or after the transfection of MAPK14-specific siRNA. After 48 h treatment with CAP, cells were lysed and subjected to western blotting to detect the levels of TP53 and p-TP53 (Ser15) respectively. Densitometric measurements represent relative TP53 phosphorylation as normalized against total TP53 levels (bottom panel). Representative data were from three independent experiments.
None
Figure 8. Autophagy induction pathway under the inhibition of mitochondrial protein synthesis.

Similar articles

Cited by

References

    1. He C, Klionsky DJ. Regulation mechanisms and signaling pathways of autophagy. Annu Rev Genet. 2009;43:67–93. - PMC - PubMed
    1. Mizushima N, Levine B, Cuervo AM, Klionsky DJ. Autophagy fights disease through cellular self-digestion. Nature. 2008;451:1069–75. - PMC - PubMed
    1. Cherra SJ, 3rd, Dagda RK, Chu CT. Review: autophagy and neurodegeneration: survival at a cost? Neuropathol Appl Neurobiol. 2010;36:125–32. - PMC - PubMed
    1. Rodriguez-Enriquez S, He L, Lemasters JJ. Role of mitochondrial permeability transition pores in mitochondrial autophagy. Int J Biochem Cell Biol. 2004;36:2463–72. - PubMed
    1. Scherz-Shouval R, Elazar Z. ROS, mitochondria and the regulation of autophagy. Trends Cell Biol. 2007;17:422–7. - PubMed

Publication types

MeSH terms