. 2012;7(5):e36319.
doi: 10.1371/journal.pone.0036319. Epub 2012 May 1.

Down-regulation of GABA(A) receptor via promiscuity with the vasoactive peptide urotensin II receptor. Potential involvement in astrocyte plasticity

Affiliations

Down-regulation of GABA(A) receptor via promiscuity with the vasoactive peptide urotensin II receptor. Potential involvement in astrocyte plasticity

Laurence Desrues et al. PLoS One. 2012.

Abstract

GABA(A) receptor (GABA(A)R) expression level is inversely correlated with the proliferation rate of astrocytes after stroke or during malignancy of astrocytoma, leading to the hypothesis that GABA(A)R expression/activation may work as a cell proliferation repressor. A number of vasoactive peptides exhibit the potential to modulate astrocyte proliferation, and the question whether these mechanisms may imply alteration in GABA(A)R-mediated functions and/or plasma membrane densities is open. The peptide urotensin II (UII) activates a G protein-coupled receptor named UT, and mediates potent vasoconstriction or vasodilation in mammalian vasculature. We have previously demonstrated that UII activates a PLC/PIPs/Ca(2+) transduction pathway, via both G(q) and G(i/o) proteins and stimulates astrocyte proliferation in culture. It was also shown that UT/G(q)/IP(3) coupling is regulated by the GABA(A)R in rat cultured astrocytes. Here we report that UT and GABA(A)R are co-expressed in cerebellar glial cells from rat brain slices, in human native astrocytes and in glioma cell line, and that UII inhibited the GABAergic activity in rat cultured astrocytes. In CHO cell line co-expressing human UT and combinations of GABA(A)R subunits, UII markedly depressed the GABA current (β(3)γ(2)>α(2)β(3)γ(2)>α(2)β(1)γ(2)). This effect, characterized by a fast short-term inhibition followed by drastic and irreversible run-down, is not relayed by G proteins. The run-down partially involves Ca(2+) and phosphorylation processes, requires dynamin, and results from GABA(A)R internalization. Thus, activation of the vasoactive G protein-coupled receptor UT triggers functional inhibition and endocytosis of GABA(A)R in CHO and human astrocytes, via its receptor C-terminus. This UII-induced disappearance of the repressor activity of GABA(A)R, may play a key role in the initiation of astrocyte proliferation.


Conflict of interest statement

Competing Interests: The authors have declared that no competing interests exist.

Figures

Figure 1
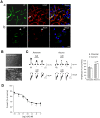
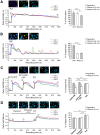
Figure 1. UII-induced depression of GABAAR in UT-expressing cerebellar astrocytes.
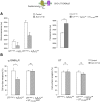
(Aa, Ab) Double immunofluorescence labeling of UT (green) and the specific astrocyte marker GFAP (red, Aa), or the mature neuron marker NeuN (red, Ab) in astrocyte-neuron co-culture from P7 rat cerebellum. Astrocytes, recognized by strong GFAP staining show UT immunoreactivity (arrows), whereas few weaker UT-stained cells express NeuN (arrowheads), and were likely attributed to mature granule cells (arrowheads, Ab). Nuclei (blue) were counterstained with DAPI. Scale bars, 50 µm. (B) Phase contrast photomicrograph of astrocytes in mono-culture, or astrocytes and neurons in co-culture at 3 days in vitro. (C) Membrane depolarizations and currents evoked by the GABAAR agonist isoguvacine (Iso, 10−4 M, 2 s for membrane potential and 5 s for chloride current) in astrocytes and cerebellar granule neurons before, during rUII (10−7 M, 40 s) application and after 2-min washout. Right, normalized amplitudes deduced by the mean Iso-evoked depolarization or current obtained before rUII application. (D) Concentration-response relationship of Iso-evoked currents from astrocytes yielding an EC50 value of 43.6±23.7 10−12 M. Data are mean ± SEM of 4 to 6 cells. *, P<0.05; ** P<0.01 compared with the corresponding control Iso-evoked current.
Figure 2
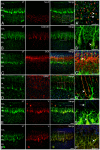
Figure 2. Co-localization of UT with γ subunits in neuron and glial components in rat cerebellum.
(A, A′) Double-fluorescence staining for UT (green) and NeuN (red) showing the presence of UT in both mature (arrowhead, merge, A′) and unidentified cells (arrows, merge, A′) in the IGL. (B) Co-staining of UT and the marker of Purkinje cells, calbindin (red), in Purkinje cell soma and dendrites (arrowhead, B′). (C) Staining for UT and the marker of migrating neuroblasts doublecortin DCX (red) depicting a diffuse labeling in the ML. (C′) UT immunopositive fibers contiguous to DCX-expressing migrating granule cells (merge, yellow, arrowhead). (D, D′) Staining for UT and GFAP (red) in glial fibers (merge, yellow, arrowhead) of the ML. (E, F) Distribution of UT and the γ1 (E) and γ2 (F) GABAAR subunits (red), in Purkinje cells (merge, arrowhead) and few extents of glia (merge, arrow) in the ML and IGL. Nuclei (blue) were counterstained with DAPI. Scale bars, 50 µm (A–F); 20 µm (A′–F′). EGL, external granule cell layer; IGL, internal granule cell layer; ML, molecular layer; PCL, Purkinje cell layer. (A′–F′) images of digitally zoomed regions corresponding to the white boxes in A–F.
Figure 3
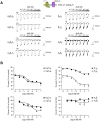
Figure 3. Effect of hUII on different GABAAR subunit combinations.
(A) Typical Iso-evoked currents at the holding potential of −60 mV, in the whole-cell configuration, on CHO stably expressing human UT (CHO-UT) and transiently transfected with cDNAs encoding α2β3γ2, α2β1γ2, α2β3γ1, α2β1γ1, β3γ2, β1γ2, α2β3 or α2β1 subunits of the GABAAR. Iso (10−4 M) was repeatedly applied for 2 s at 2 min intervals and increasing concentrations of hUII (10−13 to 10−7 M) were bath perfused in the vicinity of cells. (B) Corresponding concentration-response curves for hUII on α2β1γ2 and α2β3γ2, α2β1γ1 and α2β3γ1, β1γ2 and β3γ2, α2β1 and α2β3 receptor subunits. Data are normalized to the control Iso response immediately prior to lower hUII concentration application. Data are mean ± SEM of 3 to 23 cells.
Figure 4
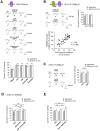
Figure 4. Pharmacological characterization of the UT-mediated inhibition of the GABAAR currents.
(A) Whole-cell current response to Iso (10−4 M, 2 s) recorded in the absence or presence of the benzodiazepine site inverse agonist DMCM (10−5 M), hUII and URP (10−8 M, each), or UT antagonists [Orn5]-URP and palosuran (10−6 M, each) in CHO expressing α2, β3 and γ2 subunits. Below, summary of the various experimental conditions (n = 3–18). (B) Comparison of the inhibitory effect of hUII and DMCM on CHO-UT-GABAAR, as summarized in bar graphs (n = 25). Bottom row, plot of the positive correlation (r2 = 0.8) of hUII-induced inhibition as function of the DMCM-evoked current decrease (n = 28). (C) Comparison of the inhibitory effect of hUII and URP on CHO-UT-GABAAR as summarized in bar graphs (n = 12–54). (D, E) Effect of [Orn5]-URP and palosuran in the absence or presence of hUII versus the effect of hUII alone. Right, summary of the various experimental conditions (n = 7–54). Data are mean ± SEM from 3 to 54 cells. ns, non significant, *, P<0.05; ** P<0.01; *** P<0.001 compared with the corresponding control Iso-evoked current.
Figure 5
Figure 5. Role of specific UT ligands on cytosolic calcium in CHO-UT.
(A, B) hUII (A) or URP (B) (10−8 M, each) provoked a robust increase of [Ca2+]c, which remained stable (A) or recovered to the basal line level (B) during washout. (C, D) Effect of the UT antagonists [Orn5]-URP (10−6 M, C) or palosuran (10−6 M, D), before and during hUII application. Right, bar graphs represent the percent increase of the [Ca2+]c during drug perfusion or during the washout period. Percent values were obtained by normalizing signals evoked during and after treatments to the value measured before ligand application. Data are mean ± SEM from 9 to 25 cells. ns, non significant; ** P<0.01; *** P<0.001 compared with the corresponding control Iso-evoked current. In each type of experiment, three different cells have been selected as representative exemples.
Figure 6
Figure 6. UII-induced fast current inhibition and GABAAR desensitization.
(A, B) Examples of currents recorded from CHO-UT-GABAAR during a long desensitizing pulse (25 s) of Iso (10−4 M), in the absence (black line) or presence (green line) of hUII (10−8 M, 1 min). (A) Exponential fit to the desensitizing current phases were shown overlaid on the currents. Bar graphs corresponding to the average desensitization constant parameter τ in the absence (τCtrl) or presence (τhUII) of hUII (n = 5). (B) Prolonged Iso (30 s) application eliciting current desenzitization followed by a time course of the recovery from desensitization, in the absence (control) or presence of hUII. Graph represents the Iso-evoked current expressed as a fraction of the peak control current induced by the long Iso application to the current amplitude elicited by each short pulse, and plotted against interpulse intervals. Data are mean ± SEM from 3 to 8 cells. *, P<0.05; ** P<0.01; *** P<0.001 compared with the corresponding control Iso-evoked current.
Figure 7
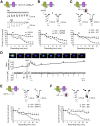
Figure 7. Intracellular mechanisms of UT-triggering GABAAR inhibition.
(A) Traces of Iso (10−4 M, 2 s)-evoked current amplitude time-course on CHO-UT-GABAAR, in control (above row) or during a 1-min application of hUII (10−8 M, bottom row). Corresponding average time course of the Iso-evoked current, in control or during and after hUII application. (B, C) Current traces before (1), during (2) a 1-min hUII application and after 20-min washout (3), in the absence or presence of GDPβS (B, 10−4 M, 15 min of dialysis) or the cocktail of kinase and phosphatase inhibitors (C, KIC, 15 min of dialysis). Note that the KIC composition consists in phosphatase inhibitor cocktail at 5 mg/ml (sodium vanadate, sodium molibdate, sodium tartrate and imidazole), Quercetin (10 µM) and staurosporine (10 µM). In the bottom rows are represented the corresponding average time course of the Iso-evoked current, in the absence or presence of GDPβS (B) or KIC (C). (D) Representative [Ca2+]c (Fura-2 AM) imaging field before, during hUII application and during washout, and time-course of the fluorescence ratio 340/380. Numbers above each curve indicate the corresponding fluorescent image. The bottom row shows simultaneous currents evoked by repetitive Iso ejections, the time scale has been enlarged to show that the current inhibition occurs before hUII-induced [Ca2+]c rise. (E, F) Current traces before (1), during (2) a 1-min hUII application and after 20 min washout (3), in the absence or presence of the rapid Ca2+ chelator BAPTA (10−3 M, E) or the dynamin inhibitory peptide DIP (10−5 M, F). In the bottom rows are represented the corresponding average time course of the Iso-evoked current, in the absence or presence of BAPTA (E) or DIP (F). Data are mean ± SEM from 3 to 21 cells. *, P<0.05; ** P<0.01; *** P<0.001 compared with the corresponding control Iso-evoked current.
Figure 8
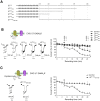
Figure 8. Receptor sequences involved in UT regulation of the GABAAR activity.
(A) Schematic diagrams mixed with sequence alignments of the HA epitope-tagged human UT, C-terminus truncated UTHA 370, UTHA 351, UTHA 332, UTHA 319 mutants, and peptidomimetics corresponding to the entire C-terminus cytosolic fragment of UT (UTc-myc 319–389). (B and C) Traces of Iso (10–4 M, 2 s)-evoked current before (1), during (2) a 1-min hUII (10−8 M) application and after 22-min washout (3). (B) Currents recorded from CHO coexpressing GABAAR and UTHA (Control), UTHA 370, UTHA 351, UTHA 332 or UTHA 319. Corresponding average time course of the current, in the absence or presence of UT truncated mutants. (C) Current traces recorded from CHO-UT-GABAAR, in the absence or presence of UTc-myc 319–389. Corresponding average time course of the Iso-evoked current, in the absence or presence of UTc-myc 319–389. In B, significance was only annotated above the time course graph during hUII perfusion and after 18-min washout, for clarity. Data are mean ± SEM from 3 to 13 cells. ns, non significant; *, P<0.05; ** P<0.01 compared with the corresponding control Iso-evoked current.
Figure 9
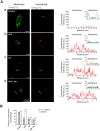
Figure 9. UT activation mediating GABAAR internalization.
(Aa–Ad) CHO-UT transiently transfected with cDNA encoding α2β3 HAγ2 GABAAR subunits. Internalization was controlled through translocation of β3 HA subunit (red) in control (Aa) or after 60 min of hUII (10−8 M, Ab), Iso (10−4 M, Ac) or hUII+Iso (Ad) incubation. Fluorescence intensity plots of green and red fluorescences corresponding to the localization of GABAAR (β3 HA) at the plasma membrane and in the cytosol, respectively, across the regions delimited by the white line scans. A.u., arbitrary unit; scale bars, 25 µm. (B) Bar graphs of the fraction of fluorescence at the plasma membrane on CHOT-UT-GABAAR or CHO-GABAAR in the different conditions. Each bar corresponds to mean ± SEM percent obtained from 3 to 18 cells. ns, non significant; ***, P<0.001 versus control in CHO-UT-GABAAR; ###, P<0.001 versus control in CHO-GABAAR.
Figure 10
Figure 10. UII-induced GABAAR loss from the plasma membrane through the C-terminus fragment of UT in CHO.
The effect of hUII on the proportion of GABAAR and UT at the cell surface of CHO was assessed by ELISA. (A) CHO transiently transfected with cDNA encoding UTc-myc and α2β3, or α2β3γ2 HA GABAAR subunits (left), or UTc-myc, and α2β3γ2 HA GABAAR subunits cotransfected with the cDNA encoding UT319–389YFP (right). Background bioluminescence (left) and fluorescence (right) were measured after anti-HA antibody and colorimetric alkaline phophatase substrate incubation, in the absence or presence of 30 min of hUII (10−8 M, left), or directly on a fluorescent plate reader (right). (B) CHO transiently transfected with cDNA encoding UTc-myc and α2β3γ2 HA GABAAR subunits (left), or cotransfected with the cDNA encoding UT319–389YFP, and immunodetected with anti-HA (left) or anti-c-myc (right) antibodies. Percentage of cell surface γ2 HA GABAAR subunit (left) or UTc-myc (right) are represented as the proportion of receptor at the plasma membrane (non permeabilized cells) to the total expressed receptor (permeabilized cells). One hundred percent correspond to values in the absence of 30 min treatment with hUII (10−8 M, 37°C). Each bar corresponds to mean ± SEM percent obtained from 5 to 7 independent experiments, in triplicates. ns, non significant; *, P<0.05; ***, P<0.001.
Figure 11
Figure 11. UII-evoked GABAAR internalization in native human astrocytes and glioma.
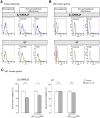
(A, B) FIow cytometric analysis of the β3 GABAAR subunit and UT expression in native human astrocytes (A) and human U87 glioma cell line (B). Cells were stained with the anti-human β3 subunit or anti-human UT in permeabilized or non permeabilized conditions (membrane receptor). The black lines depict results from control staining with only secondary antibodies. The β3 GABAAR subunit or UT cell surface expression was evaluated in the absence or presence of hUII (10−8 M, 30 min) by flow cytometry. Data obtained in A and B illustrate two representative experiments showing β3 (magenta line) and UT (yellow line) mean fluorescence in the cytosol and at the plasma membrane of a minority of non permeabilized human astrocytes (A) or U87 (B) in culture. The exposure to hUII induced internalization of β3 in both cell types and of UT only in U87 glioma. (C) U87 glioma cell line expressing UT and GABAAR composed of β3 subunit, and transfected with the cDNA encoding UT319–389YFP, and immunodetected with anti-β3 (left) or anti-UT (right) antibodies. Percentage of cell surface β3 subunit (left) or UT (right) are represented as the proportion of receptor at the plasma membrane (non permeabilized cells) to the total expressed receptor (permeabilized cells). One hundred percent correspond to values in the absence of 30 min treatment with hUII (10−8 M, 37°C). Each bar corresponds to mean ± SEM percent obtained from at least 3 independent experiments, in triplicates. ns, non significant; *, P<0.05; ***, P<0.001.
Figure 12
Figure 12. Schematic model depicting the mechanism of UT-mediated GABAAR down-regulation.
UII efficiently activates the G protein-coupled receptor UT, leading to a fast short-term decrease of the chloride current not sustained by G proteins, calcium, phosphorylation and endocytosis processes. This rapid effect involves the distal 19 C-terminal amino acids of UT and the presence of γ subunits within of the GABAAR complex (1). During the washout period, a long-term inhibition develops via a dynamin-, calcium- and phosphorylation-dependent endocytic mechanisms, requiring at least in part the 351–370 sequence of UT and GABAAR γ subunits (2). It is hypothesized that the directional cross-talk between UT and GABAAR, and the extinction of the latter at the plasma membrane, may relay transition from quiescent to proliferant astrocytes.

Similar articles

Cited by

References

    1. Takano T, Tian GF, Peng W, Lou N, Libionka W, et al. Astrocyte-mediated control of cerebral blood flow. Nature neuroscience. 2006;9:260–267. - PubMed
    1. Lo EH, Rosenberg GA. The neurovascular unit in health and disease: introduction. Stroke. 2009;40:S2–3. - PMC - PubMed
    1. Ohab JJ, Fleming S, Blesch A, Carmichael ST. A neurovascular niche for neurogenesis after stroke. The Journal of neuroscience : the official journal of the Society for Neuroscience. 2006;26:13007–13016. - PMC - PubMed
    1. Wang DD, Bordey A. The astrocyte odyssey. Prog Neurobiol. 2008;86:342–367. - PMC - PubMed
    1. Abbott NJ, Ronnback L, Hansson E. Astrocyte-endothelial interactions at the blood-brain barrier. Nature reviews Neuroscience. 2006;7:41–53. - PubMed

Publication types

MeSH terms