

Redox-sensitive YFP sensors monitor dynamic nuclear and cytosolic glutathione redox changes
- PMID: 22561702
- PMCID: PMC3382975
- DOI: 10.1016/j.freeradbiomed.2012.04.004
Redox-sensitive YFP sensors monitor dynamic nuclear and cytosolic glutathione redox changes
Abstract
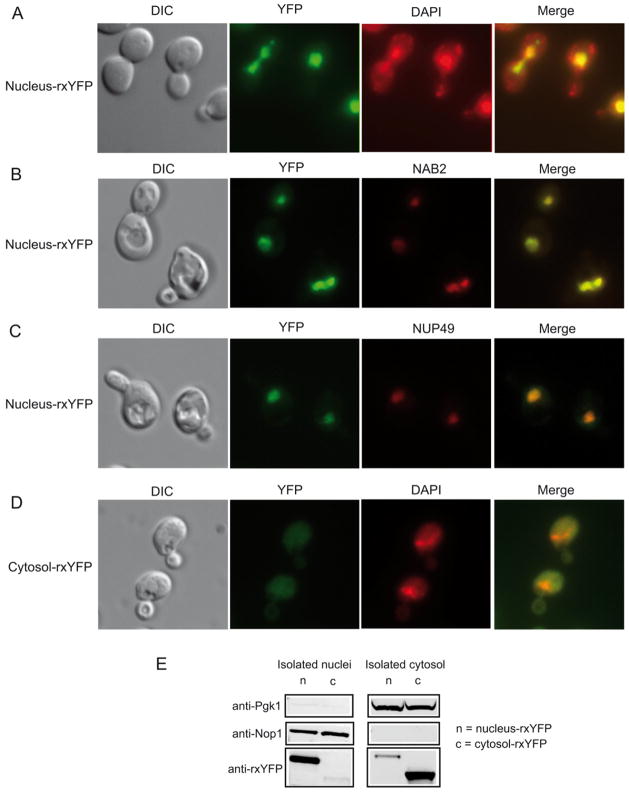
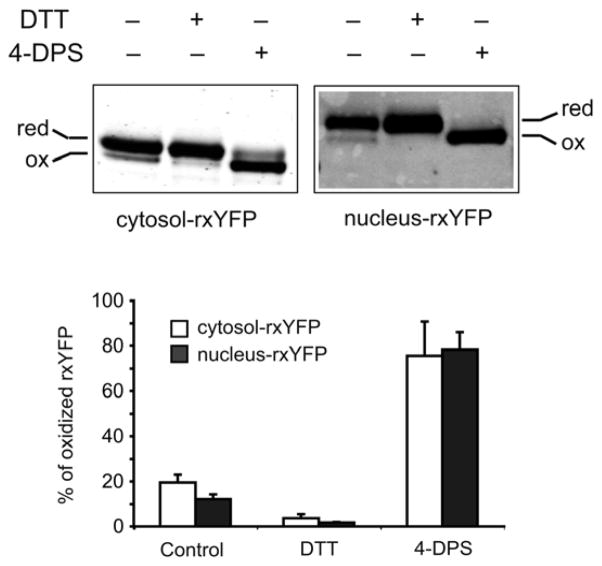
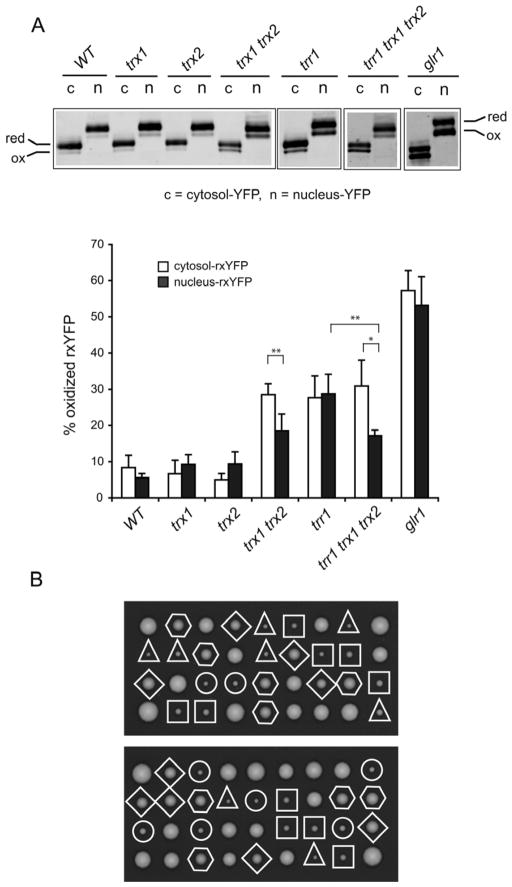
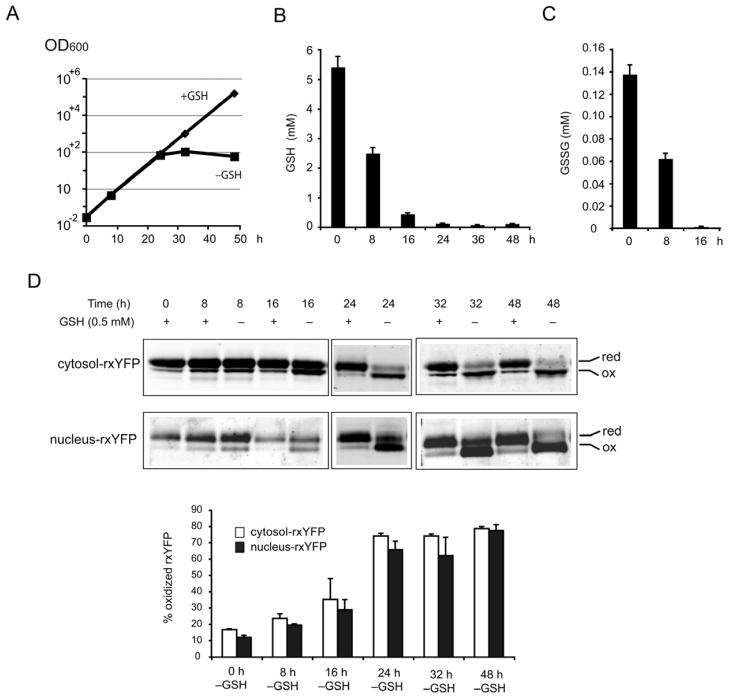
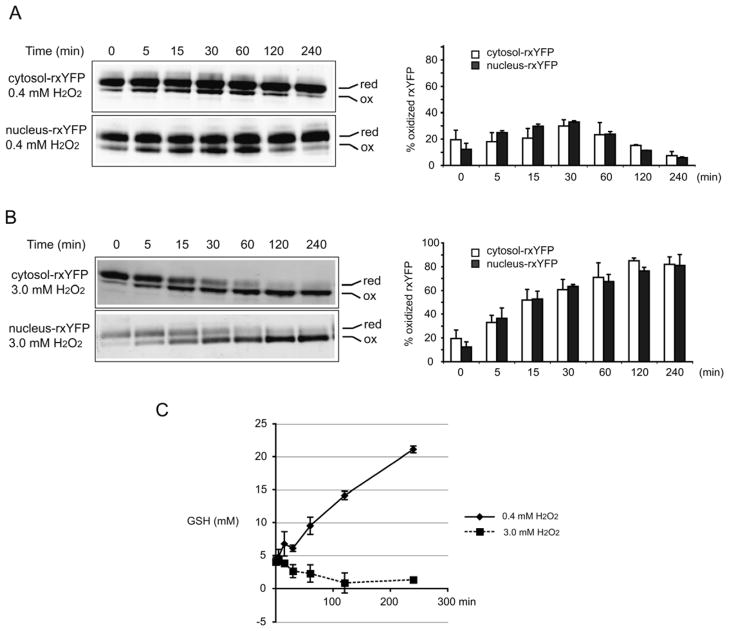
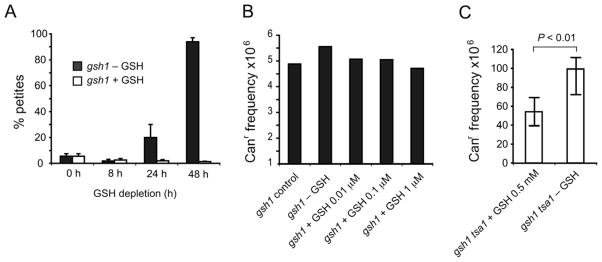
Intracellular redox homeostasis is crucial for many cellular functions but accurate measurements of cellular compartment-specific redox states remain technically challenging. To better characterize redox control in the nucleus, we targeted a yellow fluorescent protein-based redox sensor (rxYFP) to the nucleus of the yeast Saccharomyces cerevisiae. Parallel analyses of the redox state of nucleus-rxYFP and cytosol-rxYFP allowed us to monitor distinctively dynamic glutathione (GSH) redox changes within these two compartments under a given condition. We observed that the nuclear GSH redox environment is highly reducing and similar to the cytosol under steady-state conditions. Furthermore, these sensors are able to detect redox variations specific for their respective compartments in glutathione reductase (Glr1) and thioredoxin pathway (Trr1, Trx1, Trx2) mutants that have altered subcellular redox environments. Our mutant redox data provide in vivo evidence that glutathione and the thioredoxin redox systems have distinct but overlapping functions in controlling subcellular redox environments. We also monitored the dynamic response of nucleus-rxYFP and cytosol-rxYFP to GSH depletion and to exogenous low and high doses of H₂O₂ bursts. These observations indicate a rapid and almost simultaneous oxidation of both nucleus-rxYFP and cytosol-rxYFP, highlighting the robustness of the rxYFP sensors in measuring real-time compartmental redox changes. Taken together, our data suggest that the highly reduced yeast nuclear and cytosolic redox states are maintained independently to some extent and under distinct but subtle redox regulation. Nucleus- and cytosol-rxYFP register compartment-specific localized redox fluctuations that may involve exchange of reduced and/or oxidized glutathione between these two compartments. Finally, we confirmed that GSH depletion has profound effects on mitochondrial genome stability but little effect on nuclear genome stability, thereby emphasizing that the critical requirement for GSH during growth is linked to a mitochondria-dependent process.
Copyright © 2012 Elsevier Inc. All rights reserved.
Figures
Similar articles
-
Functions and cellular compartmentation of the thioredoxin and glutathione pathways in yeast.Antioxid Redox Signal. 2013 May 1;18(13):1699-711. doi: 10.1089/ars.2012.5033. Epub 2013 Feb 5. Antioxid Redox Signal. 2013. PMID: 23198979 Free PMC article. Review.
-
Redox-sensitive YFP sensors for monitoring dynamic compartment-specific glutathione redox state.Free Radic Biol Med. 2013 Dec;65:436-445. doi: 10.1016/j.freeradbiomed.2013.07.033. Epub 2013 Jul 25. Free Radic Biol Med. 2013. PMID: 23891676
-
Monitoring dynamic changes of glutathione redox state in subcellular compartments of human cells - an approach based on rxYFP biosensor.Free Radic Biol Med. 2014 Oct;75 Suppl 1:S33. doi: 10.1016/j.freeradbiomed.2014.10.769. Epub 2014 Dec 10. Free Radic Biol Med. 2014. PMID: 26461343
-
A redox-sensitive yellow fluorescent protein sensor for monitoring nuclear glutathione redox dynamics.Methods Mol Biol. 2015;1228:159-69. doi: 10.1007/978-1-4939-1680-1_13. Methods Mol Biol. 2015. PMID: 25311129
-
Mitochondrial Glutathione: Regulation and Functions.Antioxid Redox Signal. 2017 Nov 20;27(15):1162-1177. doi: 10.1089/ars.2017.7121. Epub 2017 Jun 30. Antioxid Redox Signal. 2017. PMID: 28558477 Review.
Cited by
-
Distinct redox regulation in sub-cellular compartments in response to various stress conditions in Saccharomyces cerevisiae.PLoS One. 2013 Jun 7;8(6):e65240. doi: 10.1371/journal.pone.0065240. Print 2013. PLoS One. 2013. PMID: 23762325 Free PMC article.
-
Functions and cellular compartmentation of the thioredoxin and glutathione pathways in yeast.Antioxid Redox Signal. 2013 May 1;18(13):1699-711. doi: 10.1089/ars.2012.5033. Epub 2013 Feb 5. Antioxid Redox Signal. 2013. PMID: 23198979 Free PMC article. Review.
-
Redox Mechanisms in Neurodegeneration: From Disease Outcomes to Therapeutic Opportunities.Antioxid Redox Signal. 2019 Apr 10;30(11):1450-1499. doi: 10.1089/ars.2017.7321. Epub 2018 May 4. Antioxid Redox Signal. 2019. PMID: 29634350 Free PMC article. Review.
-
A genome-wide screen in yeast identifies specific oxidative stress genes required for the maintenance of sub-cellular redox homeostasis.PLoS One. 2012;7(9):e44278. doi: 10.1371/journal.pone.0044278. Epub 2012 Sep 6. PLoS One. 2012. PMID: 22970195 Free PMC article.
-
Dynamic imaging of cellular pH and redox homeostasis with a genetically encoded dual-functional biosensor, pHaROS, in yeast.J Biol Chem. 2019 Oct 25;294(43):15768-15780. doi: 10.1074/jbc.RA119.007557. Epub 2019 Sep 5. J Biol Chem. 2019. PMID: 31488545 Free PMC article.
References
-
- Halliwell B, Gutteridge JMC, editors. Free Radicals in Biology and Medicine. 4. Oxford: Oxford University Press; 2007.
-
- Herrero E, Ros J, Belli G, Cabiscol E. Redox control and oxidative stress in yeast cells. Biochim Biophys Acta. 2008;1780:1217–1235. - PubMed
-
- Toledano MB, Kumar C, Le Moan N, Spector D, Tacnet F. The system biology of thiol redox system in Escherichia coli and yeast: differential functions in oxidative stress, iron metabolism and DNA synthesis. FEBS Lett. 2007;581:3598–3607. - PubMed
-
- Schafer FQ, Buettner GR. Redox environment of the cell as viewed through the redox state of the glutathione disulfide/glutathione couple. Free Radic Biol Med. 2001;30:1191–1212. - PubMed
-
- Ohtake Y, Yabuuchi S. Molecular cloning of the gamma-glutamylcysteine synthetase gene of Saccharomyces cerevisiae. Yeast. 1991;7:953–961. - PubMed
Publication types
MeSH terms
Substances
Grants and funding
LinkOut - more resources
Full Text Sources
Molecular Biology Databases
