

Comparison of tertiary structures of proteins in protein-protein complexes with unbound forms suggests prevalence of allostery in signalling proteins
- PMID: 22554255
- PMCID: PMC3427047
- DOI: 10.1186/1472-6807-12-6
Comparison of tertiary structures of proteins in protein-protein complexes with unbound forms suggests prevalence of allostery in signalling proteins
Abstract
Background: Most signalling and regulatory proteins participate in transient protein-protein interactions during biological processes. They usually serve as key regulators of various cellular processes and are often stable in both protein-bound and unbound forms. Availability of high-resolution structures of their unbound and bound forms provides an opportunity to understand the molecular mechanisms involved. In this work, we have addressed the question "What is the nature, extent, location and functional significance of structural changes which are associated with formation of protein-protein complexes?"
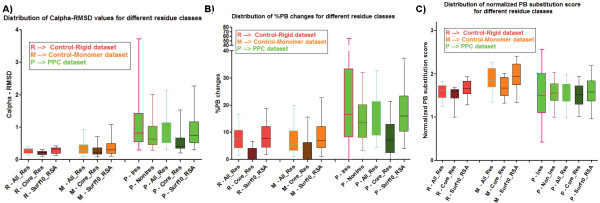
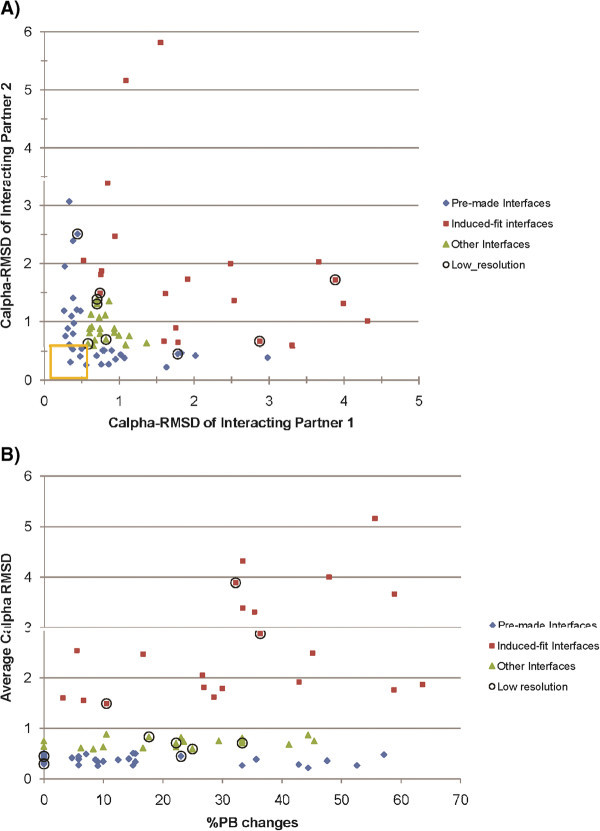
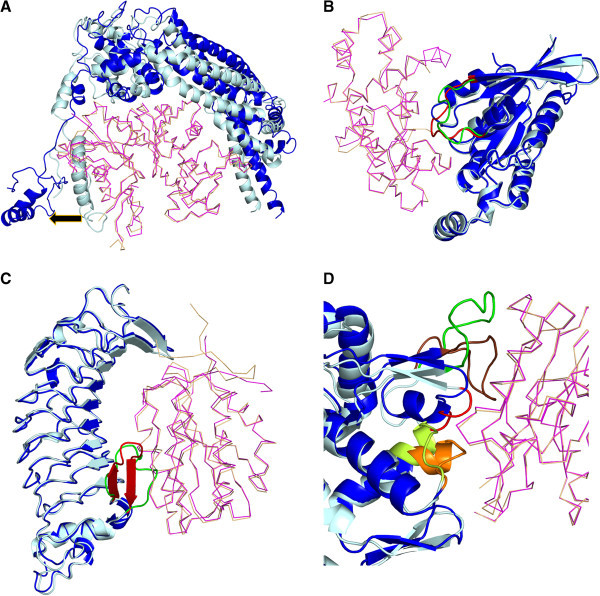
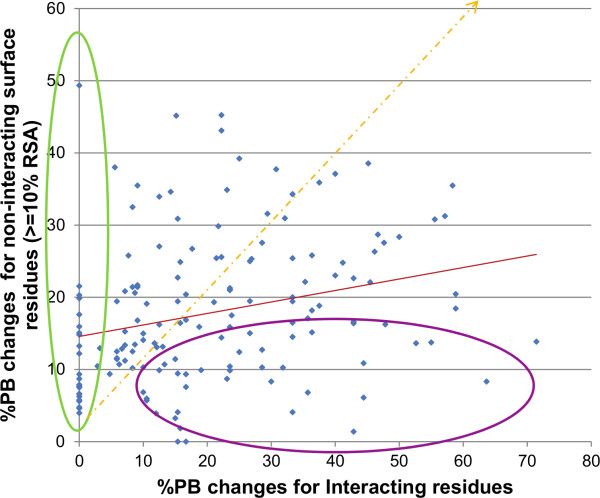
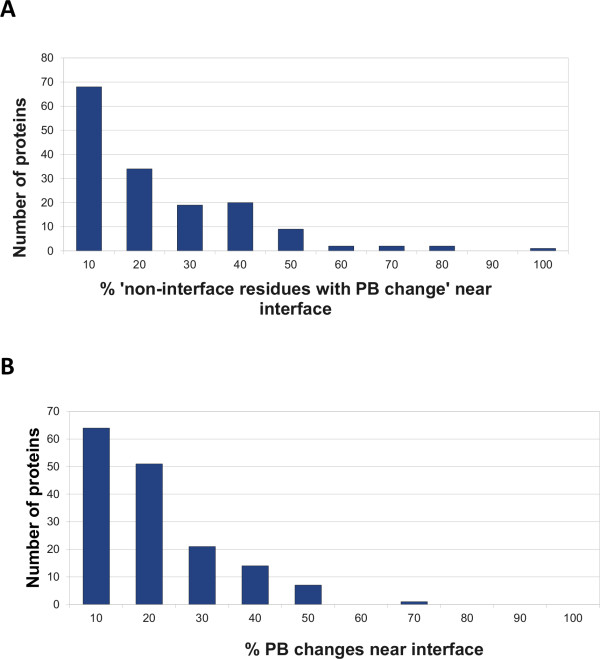
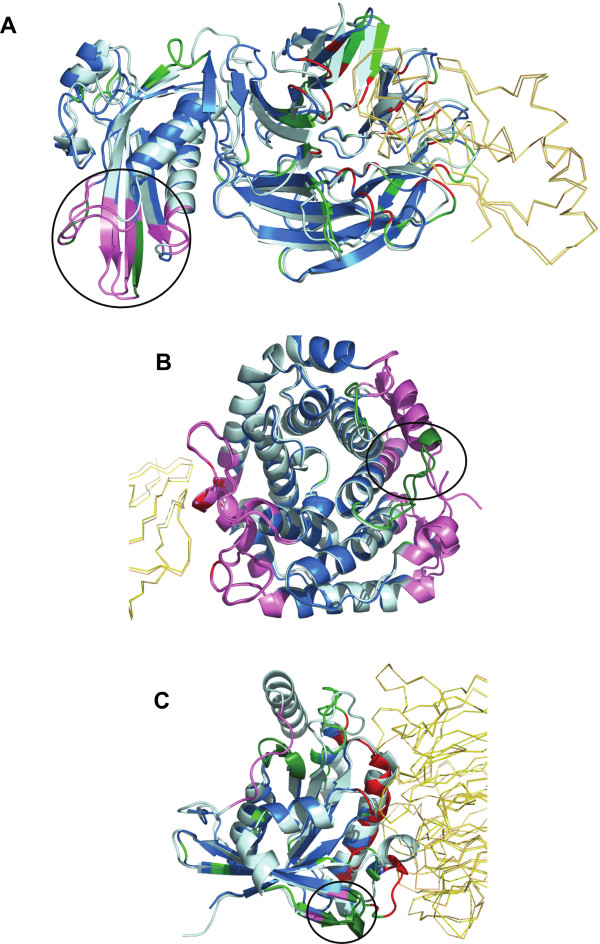
Results: A database of 76 non-redundant sets of high resolution 3-D structures of protein-protein complexes, representing diverse functions, and corresponding unbound forms, has been used in this analysis. Structural changes associated with protein-protein complexation have been investigated using structural measures and Protein Blocks description. Our study highlights that significant structural rearrangement occurs on binding at the interface as well as at regions away from the interface to form a highly specific, stable and functional complex. Notably, predominantly unaltered interfaces interact mainly with interfaces undergoing substantial structural alterations, revealing the presence of at least one structural regulatory component in every complex.Interestingly, about one-half of the number of complexes, comprising largely of signalling proteins, show substantial localized structural change at surfaces away from the interface. Normal mode analysis and available information on functions on some of these complexes suggests that many of these changes are allosteric. This change is largely manifest in the proteins whose interfaces are altered upon binding, implicating structural change as the possible trigger of allosteric effect. Although large-scale studies of allostery induced by small-molecule effectors are available in literature, this is, to our knowledge, the first study indicating the prevalence of allostery induced by protein effectors.
Conclusions: The enrichment of allosteric sites in signalling proteins, whose mutations commonly lead to diseases such as cancer, provides support for the usage of allosteric modulators in combating these diseases.
Figures
Similar articles
-
Qualitative evidence synthesis informing our understanding of people's perceptions and experiences of targeted digital communication.Cochrane Database Syst Rev. 2019 Oct 23;10(10):ED000141. doi: 10.1002/14651858.ED000141. Cochrane Database Syst Rev. 2019. PMID: 31643081 Free PMC article.
-
Depressing time: Waiting, melancholia, and the psychoanalytic practice of care.In: Kirtsoglou E, Simpson B, editors. The Time of Anthropology: Studies of Contemporary Chronopolitics. Abingdon: Routledge; 2020. Chapter 5. In: Kirtsoglou E, Simpson B, editors. The Time of Anthropology: Studies of Contemporary Chronopolitics. Abingdon: Routledge; 2020. Chapter 5. PMID: 36137063 Free Books & Documents. Review.
-
"I've Spent My Whole Life Striving to Be Normal": Internalized Stigma and Perceived Impact of Diagnosis in Autistic Adults.Autism Adulthood. 2023 Dec 1;5(4):423-436. doi: 10.1089/aut.2022.0066. Epub 2023 Dec 12. Autism Adulthood. 2023. PMID: 38116050 Free PMC article.
-
Using Experience Sampling Methodology to Capture Disclosure Opportunities for Autistic Adults.Autism Adulthood. 2023 Dec 1;5(4):389-400. doi: 10.1089/aut.2022.0090. Epub 2023 Dec 12. Autism Adulthood. 2023. PMID: 38116059 Free PMC article.
-
Trends in Surgical and Nonsurgical Aesthetic Procedures: A 14-Year Analysis of the International Society of Aesthetic Plastic Surgery-ISAPS.Aesthetic Plast Surg. 2024 Oct;48(20):4217-4227. doi: 10.1007/s00266-024-04260-2. Epub 2024 Aug 5. Aesthetic Plast Surg. 2024. PMID: 39103642 Review.
Cited by
-
Protein flexibility in the light of structural alphabets.Front Mol Biosci. 2015 May 27;2:20. doi: 10.3389/fmolb.2015.00020. eCollection 2015. Front Mol Biosci. 2015. PMID: 26075209 Free PMC article. Review.
-
Sekikaic acid and lobaric acid target a dynamic interface of the coactivator CBP/p300.Angew Chem Int Ed Engl. 2012 Nov 5;51(45):11258-62. doi: 10.1002/anie.201206815. Epub 2012 Oct 8. Angew Chem Int Ed Engl. 2012. PMID: 23042634 Free PMC article.
-
Interpreting functional effects of coding variants: challenges in proteome-scale prediction, annotation and assessment.Brief Bioinform. 2016 Sep;17(5):841-62. doi: 10.1093/bib/bbv084. Epub 2015 Oct 22. Brief Bioinform. 2016. PMID: 26494363 Free PMC article. Review.
-
Changes in protein structure at the interface accompanying complex formation.IUCrJ. 2015 Oct 16;2(Pt 6):643-52. doi: 10.1107/S2052252515015250. eCollection 2015 Nov 1. IUCrJ. 2015. PMID: 26594372 Free PMC article.
-
Rewards of divergence in sequences, 3-D structures and dynamics of yeast and human spliceosome SF3b complexes.Curr Res Struct Biol. 2021 Jun 15;3:133-145. doi: 10.1016/j.crstbi.2021.05.003. eCollection 2021. Curr Res Struct Biol. 2021. PMID: 35028595 Free PMC article.
References
-
- Reichmann D, Rahat O, Cohen M, Neuvirth H, Schreiber G. The molecular architecture of protein-protein binding sites. Curr Opin Struct Biol. 2007;17(1):67–76. - PubMed
-
- Levy ED, Pereira-Leal JB. Evolution and dynamics of protein interactions and networks. Curr Opin Struct Biol. 2008;18(3):349–357. - PubMed
-
- Janin J, Wodak SJ. Protein modules and protein-protein interaction. Introduction. Adv Protein Chem. 2002;61:1–8. - PubMed
Publication types
MeSH terms
Substances
LinkOut - more resources
Full Text Sources
