. 2012 Jun;23(12):2373-87.
doi: 10.1091/mbc.E12-01-0060. Epub 2012 Apr 25.

The Ras-like protein R-Ras2/TC21 is important for proper mammary gland development

Affiliations

The Ras-like protein R-Ras2/TC21 is important for proper mammary gland development

Romain M Larive et al. Mol Biol Cell. 2012 Jun.

Abstract

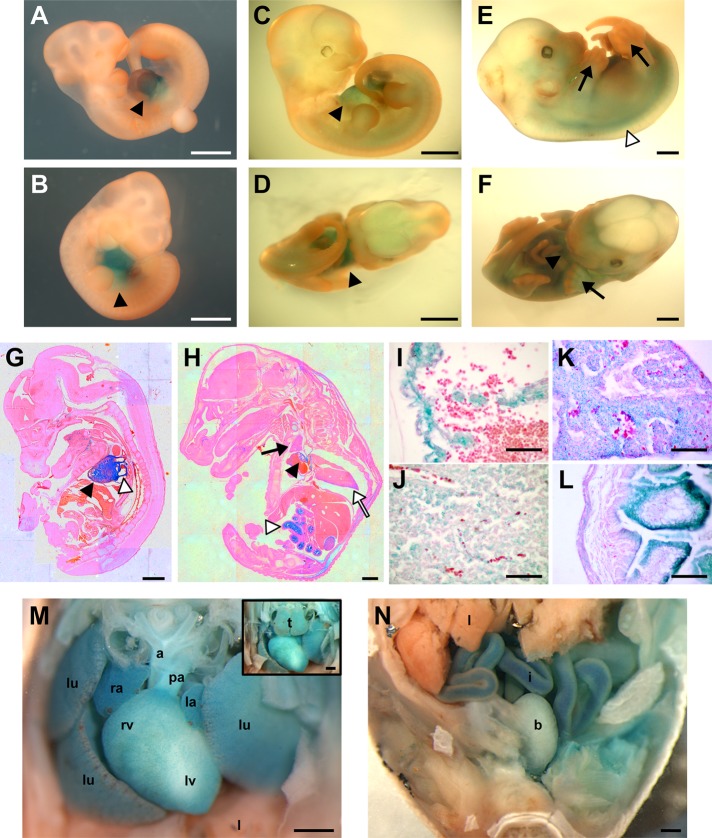
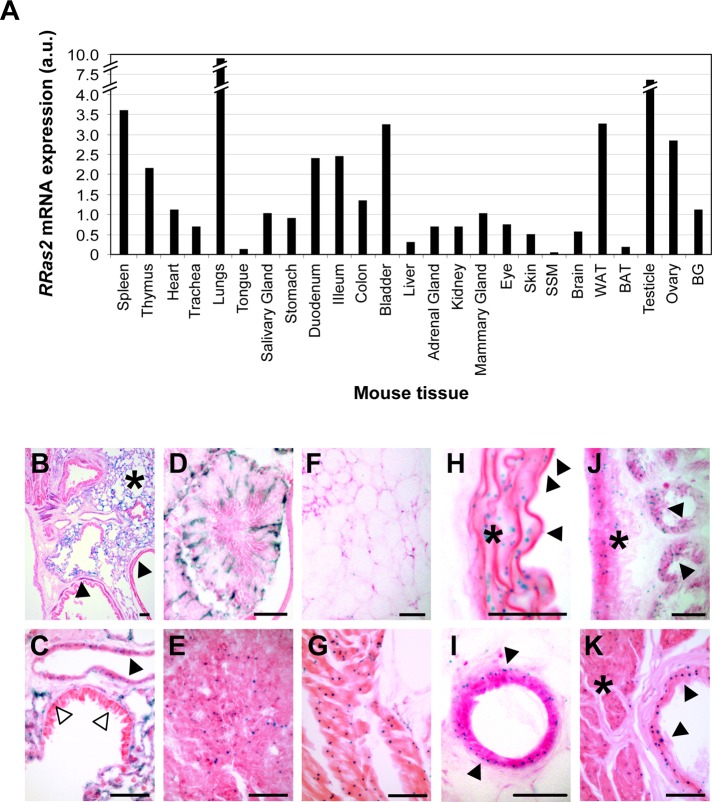
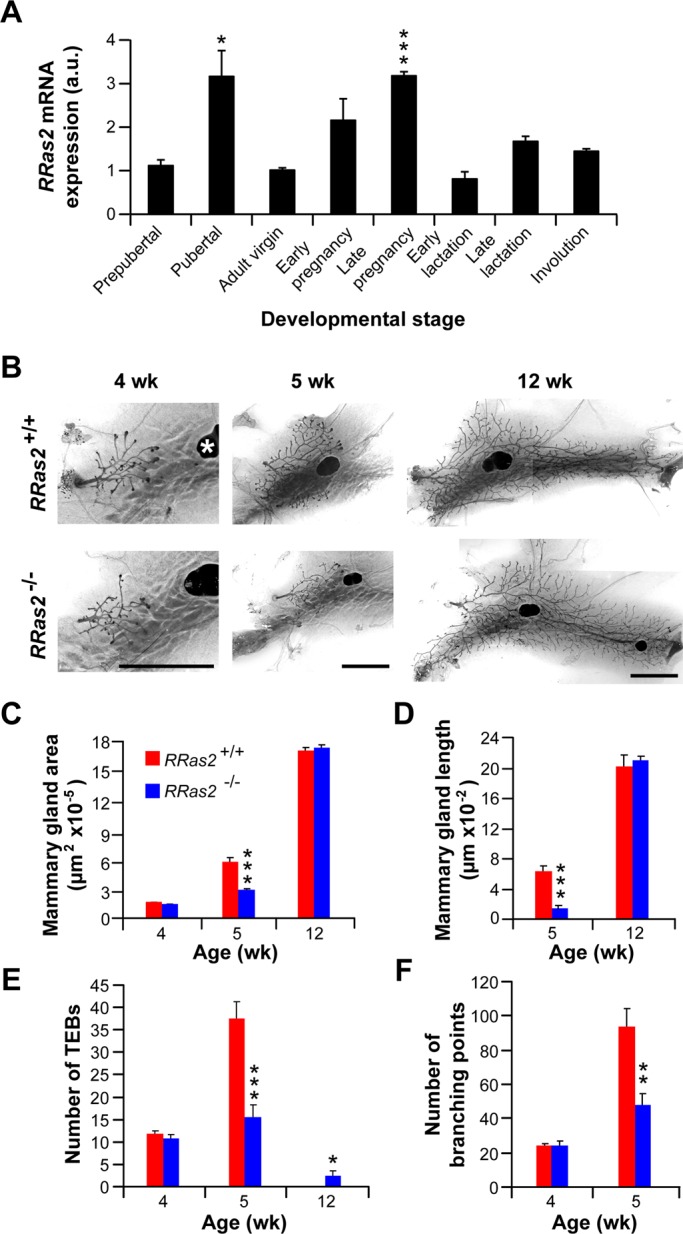
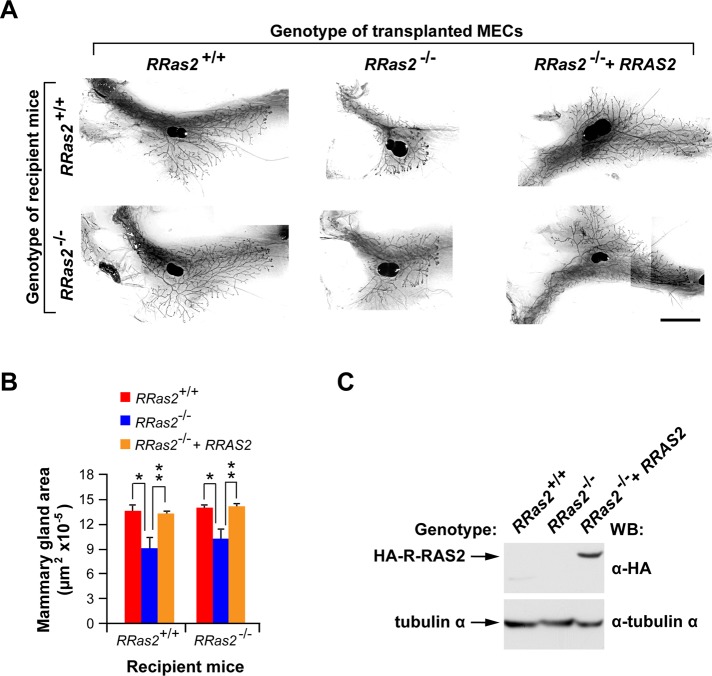
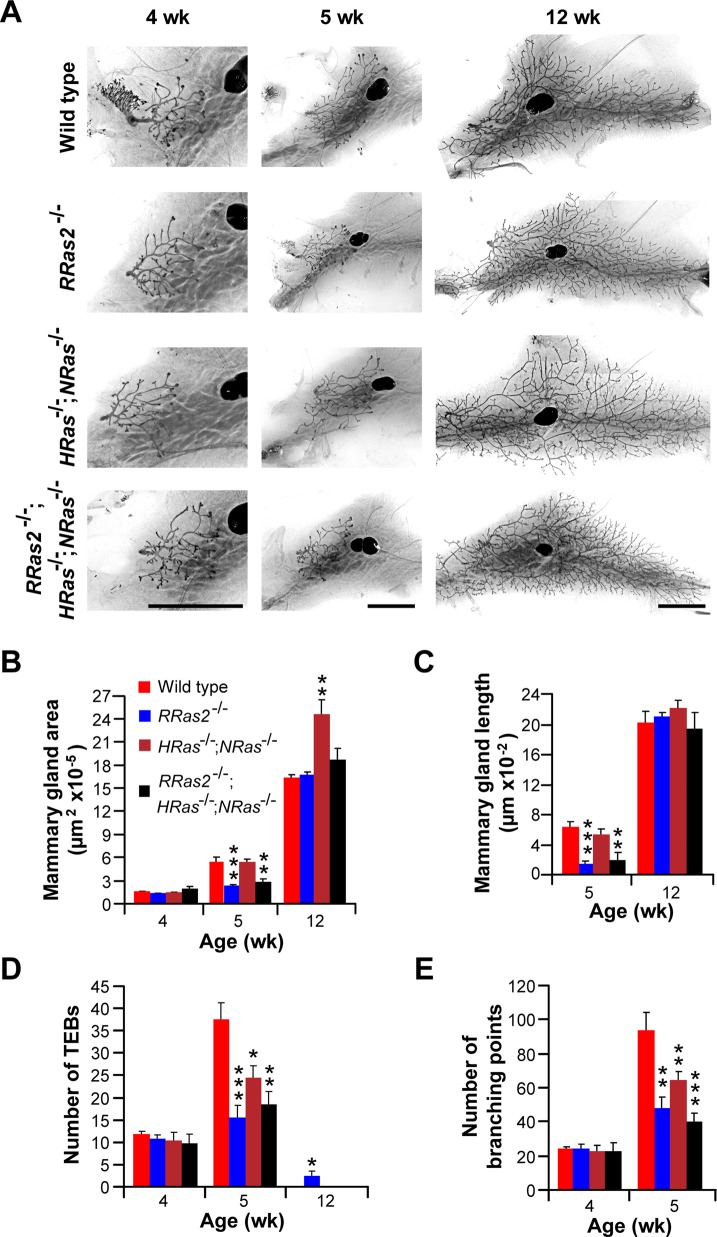
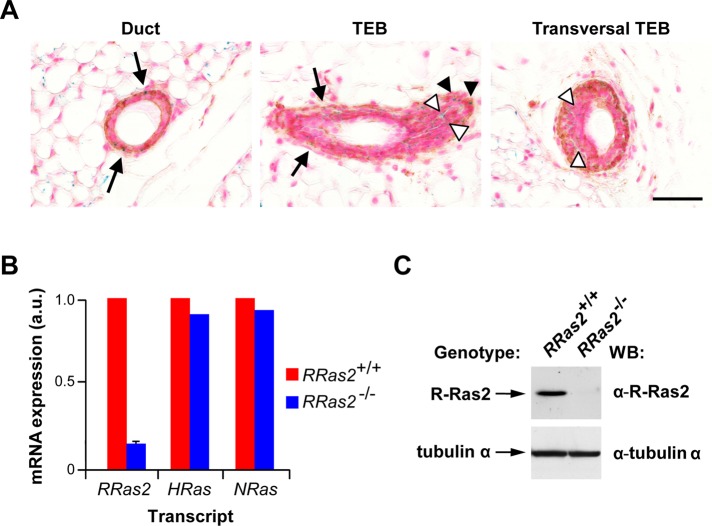
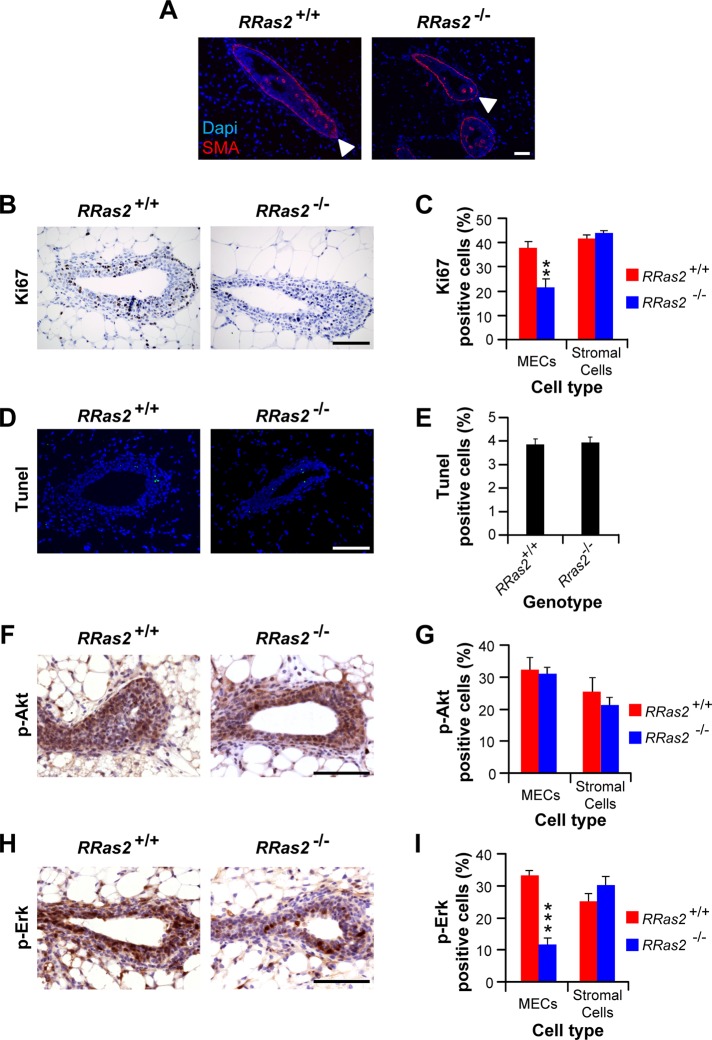
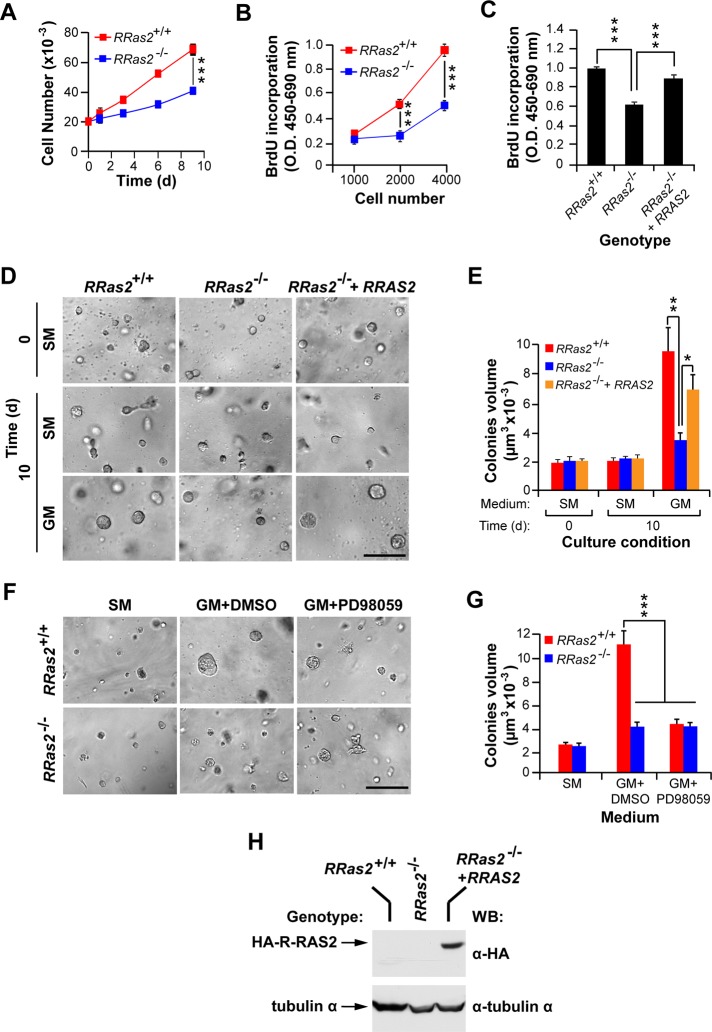
R-Ras2/TC21 is a GTPase with high sequence and signaling similarity with Ras subfamily members. Although it has been extensively studied using overexpression studies in cell lines, its physiological role remains poorly characterized. Here we used RRas2-knockout mice expressing β-galactosidase under the regulation of the endogenous RRas2 promoter to investigate the function of this GTPase in vivo. Despite its expression in tissues critical for organismal viability, RRas2(-/-) mice show no major alterations in viability, growth rates, cardiovascular parameters, or fertility. By contrast, they display a marked and specific defect in the development of the mammary gland during puberty. In the absence of R-Ras2/TC21, this gland forms reduced numbers of terminal end buds (TEBs) and ductal branches, leading to a temporal delay in the extension and arborization of the gland tree in mammary fat pads. This phenotype is linked to cell-autonomous proliferative defects of epithelial cells present in TEBs. These cells also show reduced Erk activation but wild type-like levels of phosphorylated Akt. Using compound RRas2-, HRas-, and NRas-knockout mice, we demonstrate that these GTPases act in a nonsynergistic and nonadditive manner during this morphogenic process.


Figures

FIGURE 1:
FIGURE 1:
RRas2 gene expression during mouse embryonic development. (A–F) Whole-mount X-gal staining of E10.5 (A, B), E11.5 (C, D), and E13.5 (E, F) RRas2+/− embryos to reveal the expression (blue) of the RRas2 gene. The heart (A–D, F), interdigital area (F), and spinal cord (E) are indicated by filled arrowheads, black arrows, and open arrowheads, respectively. Scale bars, 1 mm. (G, H) Sagittal sections of X-gal–stained E14.5 (G) and E16.5 (H) RRas2/ embryos. Scale bars, 1 mm. In C–E, the signal seen in the head area is due to nonspecific diffusion of the X-gal staining. In G, the closed and open arrowheads signal the heart ventricle and atrium, respectively. In H, the closed and open arrowheads indicate the heart ventricle and intestine, respectively. The black and white arrowheads signal the thymus and lung, respectively. (I–L) Magnifications of heart (I), thymus (J), lungs (K), and intestine (L) areas present in X-gal/eosin–stained E16.5 RRas2+/− embryos. Scale bar, 50 μm. (M, N) Images of thoracic (with [M, inset] or without thymus [M, main panel]) and abdominal (N) regions of an E16.5 RRas2/ embryo stained with X-gal in toto. a, aorta; b, bladder; i, intestine; l, liver; la, left atrium; lu, lung; lv, left ventricle; pa, pulmonary artery; ra, right atrium; rv, right ventricle; t, thymus. Scale bar, 500 μm.
FIGURE 2:
FIGURE 2:
Expression of the RRas2 gene in tissues of adult mice. (A) qRT-PCR analysis using total RNA from the indicated tissues (bottom) of a 3-mo-old RRas2+/+ mouse. BAT, brown adipose tissue; BG, bulbourethral gland; SSM, striated skeletal muscle; WAT, white adipose tissue. Expression values are given relative to levels found for the RRas2 transcript in the mammary gland (which were given an arbitrary value of 1). All values were normalized taking into consideration the expression levels of the housekeeping Gapdh mRNA in each sample. a.u., arbitrary units. (B–K) Cryostat sections obtained from the lung (B, C), testicle (D), ovarian corpus luteum (E), white adipose tissue (F), heart (G), aorta (H), mammary gland (I), duodenum (J), and bladder (K) of a 3-mo-old RRas2+/ mice were subjected to X-gal staining (blue) and counterstained with eosin (purple). In B and C, the closed arrowhead and asterisk signal the smooth muscle cells and alveolar cells, respectively. In C, open arrowheads indicate scattered X-gal–positive epithelial bronchial cells. In H, the closed arrowhead and asterisk signal vascular endothelial cells and smooth muscle cells, respectively. In I, the closed arrowhead indicates the outer ductal layer of myoepithelial cells. In J and K, the closed arrowheads and asterisks indicate the epithelial cells and muscle cell layer, respectively. Scale bars, 50 μm.
FIGURE 3:
FIGURE 3:
R-Ras2/TC21 regulates the timely development of the pubertal mammary gland. (A) qRT-PCR analysis of total RNA obtained from mammary glands extracted from the indicated stages. Prepubertal, pubertal, and adult virgins correspond to samples obtained from 3-, 8-, and 14-wk-old RRas2+/+ female mice, respectively. Early and late pregnancy correspond to female mice within weeks 1 and 2½ of pregnancy, respectively. The early and late lactation samples were taken 1 and 2 wk after labor, respectively. The involution phase samples were taken 3.5 d after offspring weaning. Data are given relative to the expression levels obtained in virgin adult state (which was given an arbitrary value of 1). All values were normalized taking into consideration the expression levels of the housekeeping Gapdh mRNA in each sample. *p ≤ 0.05; ***p ≤ 0.001 (n = 3). (B) Representative images of carmine alum–stained mammary fat pads obtained from female mice of the indicated ages (top) and genotypes (left). Scale bars, 500 μm. One of the inguinal lymph nodes is indicated by a white asterisk. (C–F) Quantification of the total area (C), maximal length (D), number of TEBs (E), and branching points (F) of mammary glands obtained from animals of the indicated genotypes and ages. *p ≤ 0.05, **p ≤ 0.01, ***p ≤ 0.001 when compared with values obtained in the appropriate wild-type control (n = 5–10 animals per genotype and developmental stage).
FIGURE 4:
FIGURE 4:
The developmental defects of the mammary glands of R-Ras2/TC21–deficient mice are due to intrinsic signaling deficiencies in MECs. (A) Representative images of the mammary glands developed in recipient female mice of the indicated genotypes (left) upon orthotopic transplantation with primary mammary epithelial cells (top). Those included control (left) and RRas2/ (middle) cells transduced before transplantation with a noncoding lentivirus (middle) and RRas2/ cells transduced with a lentivirus encoding a HA-tagged version of human R-RAS2/TC21 protein (right). At 7 wk after transplantation, mammary fat pads were isolated, stained with carmine alum, and photographed. Scale bar, 500 μm. (B) Quantification of the total area occupied by the mammary gland generated in the transplantation experiments described in A. *p ≤ 0.05; **p ≤ 0.01 (n = 5–8). (C) Total cellular extracts from the indicated cultures of mammary epithelial cells were analyzed by Western blot (WB) with antibodies to HA (top) to reveal the expression of the ectopic HA-R-RAS2/TC21 proteins. As a loading control, the same extracts were immunoblotted with antibodies to tubulin α (bottom).
FIGURE 5:
FIGURE 5:
R-Ras2/TC21 acts nonredundantly and nonadditively with H- and N-Ras GTPases during pubertal mammary gland development. (A) Representative images of carmine alum–stained mammary fat pads obtained from female mice of the indicated ages (top) and genotypes (left). Scale bars, 500 μm. (B–E) Quantification of the total area (B), maximal length (C), number of TEBs (D), and branching points (E) of mammary glands obtained from animals of the indicated genotypes and ages. *p ≤ 0.05, **p ≤ 0.01, ***p ≤ 0.001 when compared with values obtained in the appropriate wild-type control (n = 5–11 animals per genotype and developmental stage).
FIGURE 6:
FIGURE 6:
Expression of the RRas2 gene in pubertal mammary glands. (A) Mammary gland sections from 6-wk-old RRas2/ female mice were stained with X-gal (blue) and antibodies to smooth muscle cell actin (brown) and counterstained with nuclear fast red (purple). Left, a representative image of a duct; middle and right, two TEBs in different orientations. Black arrows signal myoepithelial cells double positive for X-gal and smooth muscle cell actin. Closed arrowheads indicate cap cells double positive for X-gal and smooth muscle cell actin. Open arrowheads pinpoint single X-gal–positive body cells. Scale bar, 50 μm. (B) Expression of the indicated Ras family transcripts in primary mammary epithelial cells derived from the indicated genotypes. Values are given relative to the expression levels of each transcript found in wild-type mice (which was given an arbitrary value of 1). n = 1 experiment performed in triplicate. (C) Western blot analysis demonstrating the expression of the endogenous R-Ras2/TC21 protein in primary mammary epithelial cells (top). As loading control, aliquots of the same extracts were subjected to immunoblot analysis using antibodies to tubulin α (bottom).
FIGURE 7:
FIGURE 7:
Reduced proliferation and Erk activation of epithelial cells in pubertal RRas2/ mammary glands. (A) Mammary glands from 5-wk-old animals of the indicated genotypes (top) were sectioned, stained with antibodies to smooth muscle cell actin (SMA, red), incubated with 4′,6′-diamidino-2-phenylindole (DAPI, blue), and analyzed by immunofluorescence microscopy. The images show a representative section of TEBs. Cap cells are indicated with open arrowheads. Scale bar, 100 μm. (B, C) Mammary glands from 5-wk-old animals of the indicated genotypes (top) were subjected to immunohistochemical analysis with antibodies to Ki67 and analyzed by standard light microscopy (B) to quantify the number of Ki67-positive cells present in both TEBs and the surrounding stroma (C). Scale bar, 100 μm. **p ≤ 0.01 compared with appropriate wild-type control (n = 6–8). (D, E) Mammary glands obtained as described were subjected to TUNEL assays and analyzed by immunofluorescence (D), and the number of apoptotic, TUNEL-positive cells present in TEBs quantified de visu (E). Scale bar, 100 μm. (F–I) Mammary glands obtained from mice of the indicated genotypes were immunostained with antibodies to either phosphorylated Akt (F) or phosphorylated Erk1/2 (H) to quantify the percentage of phospho-Akt–positive (G) and phospho-Erk1/2–positive (I) cells present in TEBs and adjacent stroma. p, phospho. Scale bars in G and H, 100 μm. In I, ***p ≤ 0.001 when compared with values obtained in wild-type mice (n = 5).
FIGURE 8:
FIGURE 8:
Defective in vitro proliferation of RRas2/ primary mammary epithelial cells. (A, B) Proliferation of primary mammary epithelial cells of the indicated genotypes using standard cell number (A) and BrdU incorporation (B) determination experiments. ***p ≤ 0.001 when compared with values obtained in control cells (n = 3). O.D., optical density. (C) Primary mammary epithelial cells obtained from RRas2/ mice were transduced with either an empty lentivirus (RRas2/) or a lentivirus encoding HA-R-RAS2/TC21 protein (RRas2/ + RRAS2) and the proliferation determined using BrdU incorporation assays. As control, we determined in parallel the proliferation of mock-infected wild-type mammary epithelial cells (RRas2+/+). ***p ≤ 0.001 when compared with values obtained in mock-transduced RRas2/ cells (n = 3). (D, E) The indicated sets of mammary epithelial cells (top) were embedded into Matrigel and cultivated in either starvation medium (SM) or growth medium (GM) for 10 d. At each experimental time point, cultures were photographed (D) and the volume of the colonies formed determined (E) as indicated in Materials and Methods. In D, scale bar, 50 μm. In E, *p ≤ 0.05 and **p ≤ 0.01 when compared with mock-infected RRas2/ cells (n = 3). (F, G) Mammary epithelial cells of the indicated genotypes (left) were maintained in Matrigel cultures containing starvation medium, (F, left), growth medium with DMSO carrier (F, middle), or growth medium supplemented with the PD98059 MEK inhibitor (F, right). After 10 d, the colonies formed were photographed (F) and their volumes determined (G). In F, scale bar, 50 μm. In G, ***p ≤ 0.001 (n = 3). (H) Western blot analysis demonstrating the expression of the ectopic HA-RRAS2/TC21 protein in the appropriate experimental samples used in the foregoing experiments (top). As loading control, aliquots of the same extracts were subjected to immunoblot analysis with antibodies to tubulin α (bottom).

Similar articles

Cited by

References

    1. Arora S, Matta A, Shukla NK, Deo SV, Ralhan R. Identification of differentially expressed genes in oral squamous cell carcinoma. Mol Carcinog. 2005;42:97–108. - PubMed
    1. Barker KT, Crompton MR. Ras-related TC21 is activated by mutation in a breast cancer cell line, but infrequently in breast carcinomas in vivo. Br J Cancer. 1998;78:296–300. - PMC - PubMed
    1. Calvo F, Crespo P. Structural and spatial determinants regulating TC21 activation by RasGRF family nucleotide exchange factors. Mol Biol Cell. 2009;20:4289–4302. - PMC - PubMed
    1. Castro-Castro A, Ojeda V, Barreira M, Sauzeau V, Navarro-Lerida I, Muriel O, Couceiro JR, Pimentel-Muinos FX, Del Pozo MA, Bustelo XR. Coronin 1A promotes a cytoskeletal-based feedback loop that facilitates Rac1 translocation and activation. EMBO J. 2011;30:3913–3927. - PMC - PubMed
    1. Chan AM, Miki T, Meyers KA, Aaronson SA. A human oncogene of the RAS superfamily unmasked by expression cDNA cloning. Proc Natl Acad Sci USA. 1994;91:7558–7562. - PMC - PubMed

Publication types

MeSH terms