. 2012 Apr 24:8:578.
doi: 10.1038/msb.2012.12.

A framework for mapping, visualisation and automatic model creation of signal-transduction networks

Affiliations

A framework for mapping, visualisation and automatic model creation of signal-transduction networks

Carl-Fredrik Tiger et al. Mol Syst Biol. .

Abstract

Intracellular signalling systems are highly complex. This complexity makes handling, analysis and visualisation of available knowledge a major challenge in current signalling research. Here, we present a novel framework for mapping signal-transduction networks that avoids the combinatorial explosion by breaking down the network in reaction and contingency information. It provides two new visualisation methods and automatic export to mathematical models. We use this framework to compile the presently most comprehensive map of the yeast MAP kinase network. Our method improves previous strategies by combining (I) more concise mapping adapted to empirical data, (II) individual referencing for each piece of information, (III) visualisation without simplifications or added uncertainty, (IV) automatic visualisation in multiple formats, (V) automatic export to mathematical models and (VI) compatibility with established formats. The framework is supported by an open source software tool that facilitates integration of the three levels of network analysis: definition, visualisation and mathematical modelling. The framework is species independent and we expect that it will have wider impact in signalling research on any system.


Conflict of interest statement

The authors declare that they have no conflict of interest.

Figures
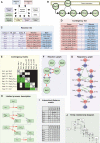
Figure 1
Figure 1
Schematic representation of the data structure. (A) The input data are the reaction and contingency lists, which contains the ‘what-aspects’ and ‘when-aspects’ of the reaction network, respectively. The rxncon software uses these lists to create a range of visualisations as well as computational models. These conversions require no additional information and are fully automated. (B) A simplified version of the Sho1 branch of the Hog pathway in S. cerevisiae will be used to illustrate the data structure. This ‘biologist’s graph’ shows the activating phosphorylation cascade (arrows) from Ste20 to Hot1. Scaffolding and membrane recruitment by Sho1 facilitates the first two phosphorylation events (grey lines). (C) The (simplified) reaction list defines the elemental reactions between pairs of components. It includes the two components (columns I and III), reaction type (column II; ‘ppi’=protein–protein interaction, ‘P+’=phosphorylation; see Table I for complete list of reactions), reaction (column IV, a concatenation of the components and the reaction type) and resultant state (column V; protein dimers or phosphorylated states). Note that each elemental state only defines a single aspect of each component’s specific state. (D) The (simplified) contingency list defines the relationship between states and reactions. It contains the affected reaction (Target, column I), the influencing state (Effector, column III), and the effect this particular state has on that reaction (contingency, column II). (E) The reaction and contingency information is summarised in the contingency matrix. The matrix is defined by elemental reactions (rows) and states (columns). The cells define how (if) each reaction (row) is affected by each state (column); that is, the reactions’ contingencies on different states. Note that only direct contingencies are considered; reaction/state intersections which do not share components are blacked out. The grey fields (‘x’) are automatic as states are binary and hence a reaction cannot occur if the state is already true. The green fields (‘!’/‘K+’) are imported from the contingency list, and all other open fields are defined as unknown effect (‘?’). This information can also be visualised in a number of graphical forms: The reaction graph (F) displays network topology with either components or their domains as functional units. The regulatory graph (G) combines the reaction and contingency information to display the causal relationship between the reactions in the network and provides a complete graphical representation of the knowledge compiled in the contingency matrix. The limited process description (H) displays the catalytic modifications in the signal-transduction network as state transitions with catalysts but without complex formation (compare Supplementary Figure S1). The interaction and distance matrices (I) provide a compact description of network topology and allow calculation of distances between nodes. Finally, the reaction and contingency data can be visualised as an entity relationship diagram (J). These visualisations and the equation system for this system, subsystem or your own favourite network defined in the same format can be automatically generated using the rxncon software.
Figure 2
Figure 2
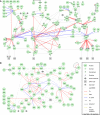
The reaction graph compactly displays the topology of the S. cerevisiae MAP kinase network. (A) The reaction graph of the MAPK network displays the components as nodes and the reactions as edges. Each component is defined by a central major node and peripheral minor nodes indicating domains, subdomains and specific residues (blue). When interacting domains and target residues are known, reactions are displayed as edges between these minor nodes. In contrast, the condensed reaction graph (B) displays each component as a single node, and each type of reaction between two nodes as a single edge. Nodes are either proteins (circles), small molecules (diamonds) or DNA (square). Edge colours indicate reaction type (co-substrates and co-products): Grey; protein–protein interaction (N/A), red; phosphorylation (−ATP, +ADP), orange; guanine nucleotide exchange (−GTP, +GDP), blue; dephosphorylation or GTPase activation (+Pi), gold; ubiquitination (−ubiquitin, −ATP, +ADP, +Pi), black; phosphotransfer or proteolytic cleavage (N/A). The domain layout in (A) prioritises readability and domain organisation does not reflect linear sequence or protein structure. Arrowheads indicate directionality for unidirectional or reciprocal catalytic modifications. Reactions for which we found no direct evidence but which are supported by convincing genetic data has been included as dashed lines. Note the much higher frequency of reported phosphorylation reactions as compared with dephosphorylation reactions; in total the network includes 68 phosphorylation reactions but only 16 dephosphorylation reactions (A).
Figure 3
Figure 3
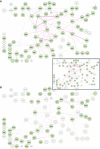
The condensed reaction graph is an excellent tool for visualisation of high-throughput data. (A) Physical interactions within the MAPK network. The global protein–protein interaction network was retrieved from Biogrid (Stark et al, 2006), filtered for physical interactions excluding two hybrid, and visualised on the condensed reaction graph (Figure 2A). Purple edges indicate protein–protein interactions and their thickness indicates the number of times they were picked up, ranging from a single time (dashed line) to 19 times. Nodes that appear faded have no interactions with any other component in the MAPK network reported in this data set. Note that the nodes that do not correspond to single ORFs would be excluded automatically (e.g., the SCF complex, DNA, lipids). The smaller, boxed network display the corresponding two-hybrid interaction network. (B) Genetic interactions within the MAPK network. Synthetic lethal interactions were retrieved from Biogrid and visualised as per (A). Also quantitative data, such as mutant phenotypes and gene expression levels, can be directly visualised on the network.
Figure 4
Figure 4
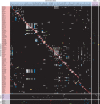
The contingency matrix provides a complete description of the network or network module. The core contingency matrix is spanned by the elemental reactions (rows, in red) and the elemental states (columns, in blue). The additional blocks are derived from the contingency list and contain the formation rules (rows) and effects (columns) of Boolean states (both purple) as well as the output of (rows) and input to (columns) the network (both grey). The cells in the matrix define how each reaction (row) depends on each state (column). The effects range from being absolutely required (‘!’), via positive effector (‘K+’), no effect (‘0’) and negative effector (‘K–’) to absolutely inhibitory (‘x’), or it can be unknown or undefined (‘?’). Each Boolean state is defined by a single operator (‘AND’ or ‘OR’) for the elemental states, other Booleans and/or inputs that defines it. The contingency matrix displayed here contains the complete MAPK network. Note that the contingency matrix is sparsely populated. This is both because most combinations of reactions and states lack overlap in components (black squares) and because we have very limited knowledge of the possible contingencies (grey squares). Overall, the information on what reactions can occur is much more abundant than on how they are regulated.
Figure 5
Figure 5
The regulatory graph visualise the causality between reactions and reveals the regulatory structure of the network. This bipartite graph illustrates the relationships between the reactions (red nodes) and states (blue nodes) within the network. Edges from reactions to states define how states are produced (blue) or consumed (purple), and each such edge corresponds to a single elemental reaction. Edges from states to reactions define how states regulate other reactions, and each such edge correspond to a single contingency (Green; absolute requirement (‘!’) or positive effector (‘K+’), red; negative effector (‘K–’) or absolutely inhibitory (‘x’)). Booleans are used when the effect on a reaction cannot be attributed to single elemental states (white diamonds (OR) or triangles (AND) connected to the states/Booleans/inputs that define them with black lines). Inputs are displayed in grey and connected to the elemental reaction(s) they influence. Likewise, outputs are displayed in grey and connected to the states they are influenced by. Signals can be followed through the network from external cues (grey; top) to transcriptional response (grey; bottom) as all edges are directional. Reactions without input are not (known to be) regulated and would therefore be expected to have constant rates; likewise states without output have no (defined) impact on the system. We have also included likely but undocumented requirements for enzyme–substrate bindings before catalysis as dashed lines. The regulatory graph is the only graphical representation using the complete information in the contingency matrix, and hence the only complete and completely graphical visualisation of the network. It is also the most potent visualisation to evaluate the degree of knowledge about the network. For example, visualisation of high-throughput data would result in disconnected reaction–state pairs only, due to the lack of regulatory information (no C2 data).
Figure 6
Figure 6
The limited process description displays all posttranslational modifications and their catalysts, but excludes complex formation. Each specific internal state is represented as a distinct node, although some intermediate phosphorylation states have been excluded. Phosphorylations are indicated with red arrows (ATP as co-substrate and ADP as co-product), GEF reactions as orange arrows (−GTP, +GDP), and dephosphorylation or GAP reactions as blue arrows (+Pi). Only a fraction of the catalytic modifications have a known catalyst for both forward and reverse reactions, and the required state of the catalyst known is in even fewer cases. Therefore, even this highly simplified process description includes uncertainty in the required states of both catalysts and substrates. In this visualisation, this uncertainty has been shown by using a single catalysis arrow from a box including all potentially active state of the catalyst to the basic state of the substrate (completely unphosphorylated for kinase reactions, or completely phosphorylated for phosphatase reactions). While these simplifications are unsupported, including additional catalytic arrows would be equally arbitrary with the added drawback of making the figure more complex (see Supplementary Figure S2). Despite the need for implicit assumptions, the process description is useful as it is very explicit and intuitive to read.

Similar articles

Cited by

References

    1. Ai W, Bertram PG, Tsang CK, Chan TF, Zheng XF (2002) Regulation of subtelomeric silencing during stress response. Mol Cell 10: 1295–1305 - PubMed
    1. Alepuz PM, de Nadal E, Zapater M, Ammerer G, Posas F (2003) Osmostress-induced transcription by Hot1 depends on a Hog1-mediated recruitment of the RNA Pol II. EMBO J 22: 2433–2442 - PMC - PubMed
    1. Alepuz PM, Jovanovic A, Reiser V, Ammerer G (2001) Stress-induced map kinase Hog1 is part of transcription activation complexes. Mol Cell 7: 767–777 - PubMed
    1. Andrews BJ, Herskowitz I (1989) Identification of a DNA binding factor involved in cell-cycle control of the yeast HO gene. Cell 57: 21–29 - PubMed
    1. Andrews BJ, Moore LA (1992) Interaction of the yeast Swi4 and Swi6 cell cycle regulatory proteins in vitro. Proc Natl Acad Sci USA 89: 11852–11856 - PMC - PubMed

Publication types

MeSH terms

LinkOut - more resources