. 2012 Sep;69(18):3101-13.
doi: 10.1007/s00018-012-0981-x. Epub 2012 Apr 20.

CCN1: a novel inflammation-regulated biphasic immune cell migration modulator

Affiliations

CCN1: a novel inflammation-regulated biphasic immune cell migration modulator

Madlen Löbel et al. Cell Mol Life Sci. 2012 Sep.

Abstract

In this study, we performed a comprehensive analysis of the effect of CCN1 on the migration of human immune cells. The molecule CCN1, produced by fibroblasts and endothelial cells, is considered as an important matrix protein promoting tissue repair and immune cell adhesion by binding various integrins. We recently reported that CCN1 therapy is able to suppress acute inflammation in vivo. Here, we show that CCN1 binds to various immune cells including T cells, B cells, NK cells, and monocytes. The addition of CCN1 in vitro enhances both actin polymerization and transwell migration. Prolonged incubation with CCN1, however, results in the inhibition of migration of immune cells by a mechanism that involves downregulation of PI3Kγ, p38, and Akt activation. Furthermore, we observed that immune cells themselves produce constitutively CCN1 and secretion is induced by pro-inflammatory stimuli. In line with this finding, patients suffering from acute inflammation had enhanced serum levels of CCN1. These findings extend the classical concept of CCN1 as a locally produced cell matrix adhesion molecule and suggest that CCN1 plays an important role in regulating immune cell trafficking by attracting and locally immobilizing immune cells.


Conflict of interest statement

The authors declare that they have no conflicts of interest.

Figures

Fig. 1
Fig. 1
Human PBMCs bind CCN1. a Binding of exogenous recombinant human CCN1 (CCN1 after incubation) was analyzed by flow cytometry using a monoclonal antibody against human CCN1 (CCN1). PBMCs were further co-stained for CD3, CD4, CD8, CD19, CD56, and CD14, respectively. The filled grey histogram shows the signal of the secondary antibody (secondary Ab) alone. The black curve indicates staining of untreated PBMCs with primary and secondary antibody and the grey curve indicates PBMCs that were incubated with recombinant CCN1. Histograms of one representative experiment out of five experiments are shown. b Adhesion of CFDA-labeled primary human PBMCs to a plate either coated with BSA, recombinant human CCN1, or fibronectin (FN). When PBMCs were co-incubated with soluble CCN1, adhesion to FN was significantly diminished (FN + sCCN1). Shown is the ratio of CFDA intensity in relation to BSA (n = 9/10). Statistical analyses were performed using the Wilcoxon signed-rank test with **p < 0.01
Fig. 2
Fig. 2
CCN1 promotes migration of human primary lymphocytes and monocytes. a Actin polymerization in human lymphocytes (black circles) and monocytes (grey quadrates) after incubation with 200, 400, and 800 ng/ml of CCN1 protein or 200 ng/ml SDF-1α (right panel) was detected by staining with Phalloidin-FITC. Shown is the change in Phalloidin intensity (%) to unstimulated cells (control) (n = 3). be Transwell migration of PBMCs. b Migration of PBMCs to 200 ng/ml of CCN1 in the lower well. Cells were harvested, stained extracellularly for CD3, CD4, CD8, CD19, CD56, or CD14 and counted by flow cytometry. Indicated is the ratio of the number of each cell subpopulation that migrated in response to CCN1 to the number of cells that migrated in medium alone (control, n = 8). c Migration of PBMCs to 200 ng/ml of CCN1 either in the lower well or in the lower and the upper well. Cells were harvested and the migrated cells of the monocyte population were counted by flow cytometry. Comparable experiments for monocytes were performed with SDF-1α. Shown is the ratio of migrated cells to unstimulated cells (control, n = 5). d PBMCs were incubated with (24 h CCN1-Pre) or without CCN1 (control) at 200 ng/ml for 24 h and then transwell migration of CD3+ cells was analyzed (n = 6). e PBMCs were incubated with CCN1 at 200, 20, and 2 ng/ml for 24 h (24 h CCN1-Pre) and then migration of CD3+ cells was studied (n = 2 × 2). Repeated experiments from two donors are shown. Statistical analyses were performed using the Mann–Whitney U test with *p < 0.05, **p < 0.01, and n.s. not significant
Fig. 3
Fig. 3
CCN1 promotes migration via PI3K/Akt/p38 signaling. a Intracellular signaling was analyzed in THP-1 cells by immunofluorescence staining using specific antibodies. Shown are MFIs for the staining of PI3Kγ (n = 6), pAktT308 (n = 8), p38 MAPK (n = 8), and pNFκBSer536 p65 (n = 4). Cells were either kept in medium or were pre-incubated with CCN1 (400 ng/ml) for 24 h. Afterwards, the cells were washed and both groups stimulated or re-stimulated, respectively, with 400 ng/ml of CCN1 for the indicated time points. Shown is the ratio of CCN1-stimulated cells to unstimulated cells without (open circle) or pre-incubated with CCN1 (open triangle). Statistical analysis was performed using the Wilcoxon signed-rank test with *p < 0.05, and **p < 0.01 for the CCN1 stimulation without pre-incubation. b Shown is the ratio of PI3Kγ, pAkt, p38, and pNFκB levels of cells stimulated with CCN1 for 24 h to unstimulated cells. Statistical analysis was performed using the Wilcoxon signed-rank test with *p < 0.05. c Inhibition of CCN1-induced migration of THP-1 cells by the inhibitors for PI3K Ly294_002 at 10 μM (n = 4), PI3Kγ inhibitor at 10 μM (n = 3), the Akt inhibitor Triciribin at 10 μM (n = 3), and MEK inhibitor PD98059 at 50 μM (n = 4), respectively. Shown is the ratio of CCN1-stimulated cells in response to unstimulated cells treated with the respective inhibitor. Statistical analysis was performed using the t test with *p < 0.05, **p < 0.01, and ***p < 0.001. The figure was taken and adapted from the supplemental data of our publication [32] in accordance with the Permissions and Rights of “Circulation”
Fig. 4
Fig. 4
Human PBMCs express CCN1. a Expression of CCN1 in PBMC subsets detected by flow cytometry. Cells were stained extra- and intracellularly for CCN1 and the surface markers CD3, CD4, CD8, CD19, CD56, and CD14. The grey line shows the secondary antibody alone and the black line shows the anti-CCN1 staining. Shown is one representative experiment out of three. b Expression of CCN1 in PBMCs detected by fluorescence microscopy. Monoclonal mouse anti-human CCN1 antibody was used for detection and green fluorescence was achieved by coupling to secondary antibody donkey anti-mouse Alexa 488. Co-staining was done with DAPI. Original magnification ×400. Shown is one representative donor out of two. c Expression of CCN1 variants in PBMCs detected by RT-PCR was performed with primers spanning CCN1 exons 3 and 4 including a part of CCN1 intron 3 detecting a splice variant (581 bp) and the full-length transcript (450 bp). Shown are nine different donors. d Expression of CCN1 in CD34+ cells from human bone marrow. Cells were stained intracellularly for CCN1 (black line) using a fluorescence-labeled secondary antibody and an antibody against the surface molecule CD34. The secondary antibody alone was used as control (grey line) for specific staining. Shown is one representative experiment out of three
Fig. 5
Fig. 5
Human PBMCs secrete CCN1. a Intracellular staining for CCN1 of CD3+ and CD14+ cells treated with BFA. Cells were either unstimulated in medium with 10 % AB serum or stimulated with 100 ng/ml TNF-α, 1 μg/ml EGF or 100 ng/ml MCP-1 for 18 h, respectively. Staining for CCN1 was performed with polyclonal anti-CCN1-Biotin antibody that was detected by streptavidin-PE. As background staining control, streptavidin-PE was used alone. Shown is one representative experiment and a table with results from all donors (n = 7). The difference in percent of CCN1-positive cells was calculated using Wilcoxon signed-rank test. b PBMCs were kept for 5 h either in medium containing 10 % AB serum alone or stimulated with TNF-α in the presence (n = 9) or absence (n = 5) of BFA. Lysates and supernatants of the cells were measured for CCN1 by ELISA. Statistical analysis was performed using the Mann–Whitney U test with *p < 0.05
Fig. 6
Fig. 6
CCN1 in patients with acute inflammation. a CCN1 was measured in plasma samples of patients with sepsis early during the disease course (V1, n = 12) and after (V2, n = 8) 48 h of antibiotic therapy and in healthy control patients (n = 8) by ELISA (DRG Diagnostics). b CCN1 was measured in serum samples of patients with inflammatory dilated cardiomyopathy (DCMi, n = 25) and giant cell myocarditis (GCM, n = 6) by ELISA (DRG Diagnostics) and compared to the control group (n = 11) of healthy donors, shown already in a. Statistical analyses were performed using the Mann–Whitney U test with *p < 0.05
Fig. 7
Fig. 7
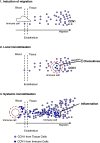
Proposed model of the biphasic effect of CCN1 on immune cell migration. 1 Initial stimulation with CCN1 attracts immune cells. 2 Prolonged stimulation with CCN1 leads to local immobilization of immune cells and renders them refractory to further chemotactic stimulation. 3 Severe local inflammation leads to enhanced secretion of CCN1 and enhanced serum levels resulting in systemic immobilization of immune cells [32]

Similar articles

Cited by

References

    1. Jedsadayanmata A, Chen CC, Kireeva ML, et al. Activation-dependent adhesion of human platelets to Cyr61 and Fisp12/mouse connective tissue growth factor is mediated through integrin alpha(IIb)beta(3) J Biol Chem. 1999;274:24321–24327. doi: 10.1074/jbc.274.34.24321. - DOI - PubMed
    1. Todorovic V, Chen CC, Hay N, et al. The matrix protein CCN1 (CYR61) induces apoptosis in fibroblasts. J Cell Biol. 2005;171:559–568. doi: 10.1083/jcb.200504015. - DOI - PMC - PubMed
    1. Brigstock DR. Regulation of angiogenesis and endothelial cell function by connective tissue growth factor (CTGF) and cysteine-rich 61 (CYR61) Angiogenesis. 2002;5:153–165. doi: 10.1023/A:1023823803510. - DOI - PubMed
    1. Bleau AM, Planque N, Perbal B, et al. CCN proteins and cancer: two to tango. Front Biosci. 2005;10:998–1009. doi: 10.2741/1594. - DOI - PubMed
    1. Kireeva ML, Mo FE, Yang GP, et al. Cyr61, a product of a growth factor-inducible immediate-early gene, promotes cell proliferation, migration, and adhesion. Mol Cell Biol. 1996;16:1326–1334. - PMC - PubMed

Publication types

MeSH terms

LinkOut - more resources