A core subunit of Polycomb repressive complex 1 is broadly conserved in function but not primary sequence
- PMID: 22517748
- PMCID: PMC3344975
- DOI: 10.1073/pnas.1118678109
A core subunit of Polycomb repressive complex 1 is broadly conserved in function but not primary sequence
Abstract
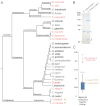
Polycomb Group (PcG) proteins mediate heritable gene silencing by modifying chromatin structure. An essential PcG complex, PRC1, compacts chromatin and inhibits chromatin remodeling. In Drosophila melanogaster, the intrinsically disordered C-terminal region of PSC (PSC-CTR) mediates these noncovalent effects on chromatin, and is essential for viability. Because the PSC-CTR sequence is poorly conserved, the significance of its effects on chromatin outside of Drosophila was unclear. The absence of folded domains also made it difficult to understand how the sequence of PSC-CTR encodes its function. To determine the mechanistic basis and extent of conservation of PSC-CTR activity, we identified 17 metazoan PSC-CTRs spanning chordates to arthropods, and examined their sequence features and biochemical properties. PSC-CTR sequences are poorly conserved, but are all highly charged and structurally disordered. We show that active PSC-CTRs--which bind DNA tightly and inhibit chromatin remodeling efficiently--are distinguished from less active ones by the absence of extended negatively charged stretches. PSC-CTR activity can be increased by dispersing its contiguous negative charge, confirming the importance of this property. Using the sequence properties defined as important for PSC-CTR activity, we predicted the presence of active PSC-CTRs in additional diverse genomes. Our analysis reveals broad conservation of PSC-CTR activity across metazoans. This conclusion could not have been determined from sequence alignments. We further find that plants that lack active PSC-CTRs instead possess a functionally analogous PcG protein, EMF1. Thus, our study suggests that a disordered domain with dispersed negative charges underlies PRC1 activity, and is conserved across metazoans and plants.
Conflict of interest statement
The authors declare no conflict of interest.
Figures


Similar articles
-
Compaction of chromatin by diverse Polycomb group proteins requires localized regions of high charge.Genes Dev. 2011 Oct 15;25(20):2210-21. doi: 10.1101/gad.17288211. Genes Dev. 2011. PMID: 22012622 Free PMC article.
-
DNA Binding Reorganizes the Intrinsically Disordered C-Terminal Region of PSC in Drosophila PRC1.J Mol Biol. 2020 Aug 7;432(17):4856-4871. doi: 10.1016/j.jmb.2020.07.002. Epub 2020 Jul 3. J Mol Biol. 2020. PMID: 32628956 Free PMC article.
-
Inhibition of chromatin remodeling by polycomb group protein posterior sex combs is mechanistically distinct from nucleosome binding.Biochemistry. 2010 Nov 9;49(44):9438-48. doi: 10.1021/bi100532a. Biochemistry. 2010. PMID: 20873869 Free PMC article.
-
[Maintenance of cellular memory by Polycomb group genes].C R Acad Sci III. 2001 Jul;324(7):577-88. doi: 10.1016/s0764-4469(01)01329-4. C R Acad Sci III. 2001. PMID: 11475999 Review. French.
-
Diversity of Polycomb group complexes in plants: same rules, different players?Trends Genet. 2009 Sep;25(9):414-23. doi: 10.1016/j.tig.2009.07.002. Epub 2009 Aug 27. Trends Genet. 2009. PMID: 19716619 Review.
Cited by
-
Identification of polycomb repressive complex 1 and 2 core components in hexaploid bread wheat.BMC Plant Biol. 2020 Oct 14;20(Suppl 1):175. doi: 10.1186/s12870-020-02384-6. BMC Plant Biol. 2020. PMID: 33050875 Free PMC article.
-
The CBX family of proteins in transcriptional repression and memory.J Biosci. 2020;45:16. J Biosci. 2020. PMID: 31965994
-
A Two-Step Mechanism for Creating Stable, Condensed Chromatin with the Polycomb Complex PRC1.Molecules. 2024 Jan 9;29(2):323. doi: 10.3390/molecules29020323. Molecules. 2024. PMID: 38257239 Free PMC article.
-
Conformational buffering underlies functional selection in intrinsically disordered protein regions.Nat Struct Mol Biol. 2022 Aug;29(8):781-790. doi: 10.1038/s41594-022-00811-w. Epub 2022 Aug 10. Nat Struct Mol Biol. 2022. PMID: 35948766 Free PMC article.
-
The domesticated transposase ALP2 mediates formation of a novel Polycomb protein complex by direct interaction with MSI1, a core subunit of Polycomb Repressive Complex 2 (PRC2).PLoS Genet. 2020 May 28;16(5):e1008681. doi: 10.1371/journal.pgen.1008681. eCollection 2020 May. PLoS Genet. 2020. PMID: 32463832 Free PMC article.
References
-
- Simon JA, Kingston RE. Mechanisms of polycomb gene silencing: Knowns and unknowns. Nat Rev Mol Cell Biol. 2009;10:697–708. - PubMed
-
- Mager J, Montgomery ND, de Villena FP, Magnuson T. Genome imprinting regulated by the mouse Polycomb group protein Eed. Nat Genet. 2003;33:502–507. - PubMed
-
- Martinez AM, Cavalli G. The role of polycomb group proteins in cell cycle regulation during development. Cell Cycle. 2006;5:1189–1197. - PubMed
Publication types
MeSH terms
Substances
Grants and funding
LinkOut - more resources
Full Text Sources
Molecular Biology Databases

