. 2012;7(4):e34860.
doi: 10.1371/journal.pone.0034860. Epub 2012 Apr 3.

Deregulation of CREB signaling pathway induced by chronic hyperglycemia downregulates NeuroD transcription

Affiliations

Deregulation of CREB signaling pathway induced by chronic hyperglycemia downregulates NeuroD transcription

In-Su Cho et al. PLoS One. 2012.

Abstract

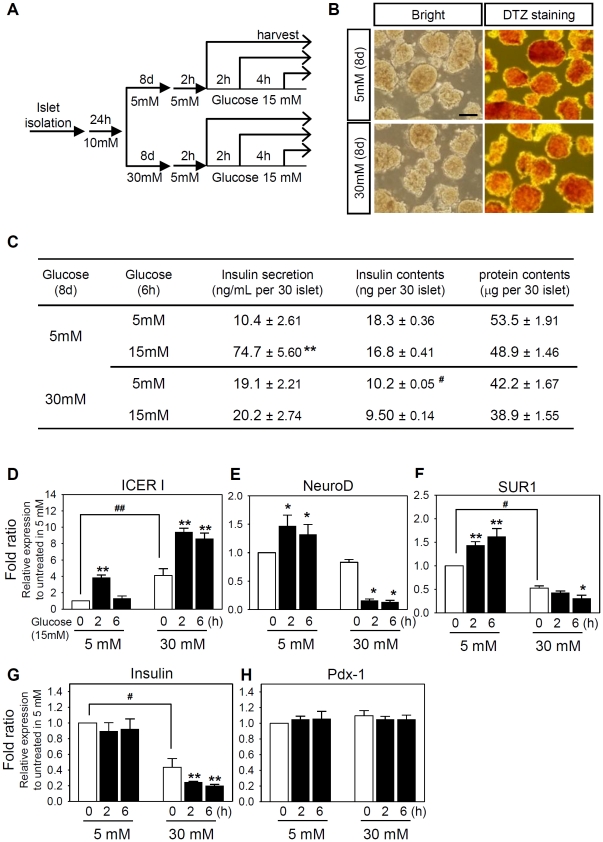
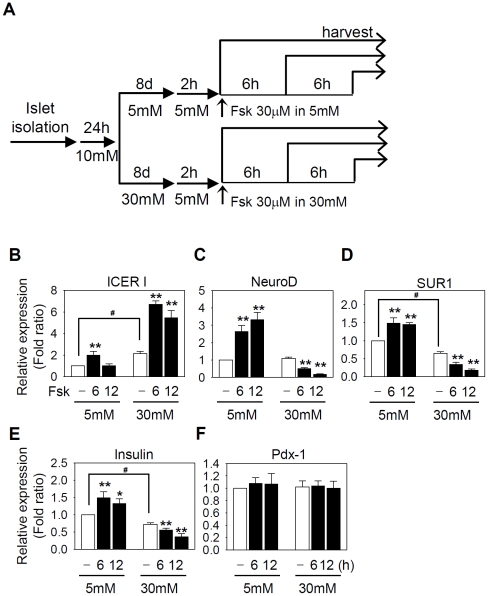
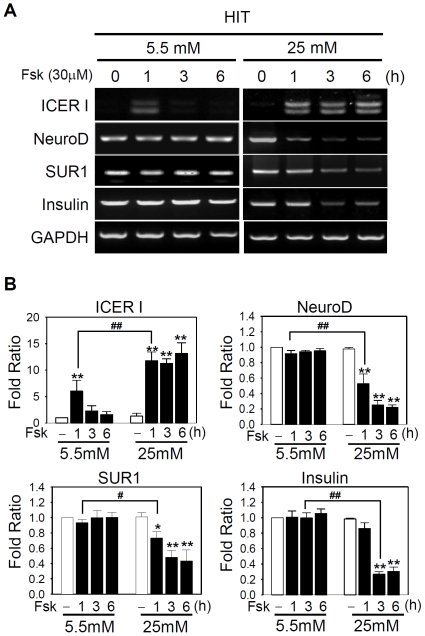
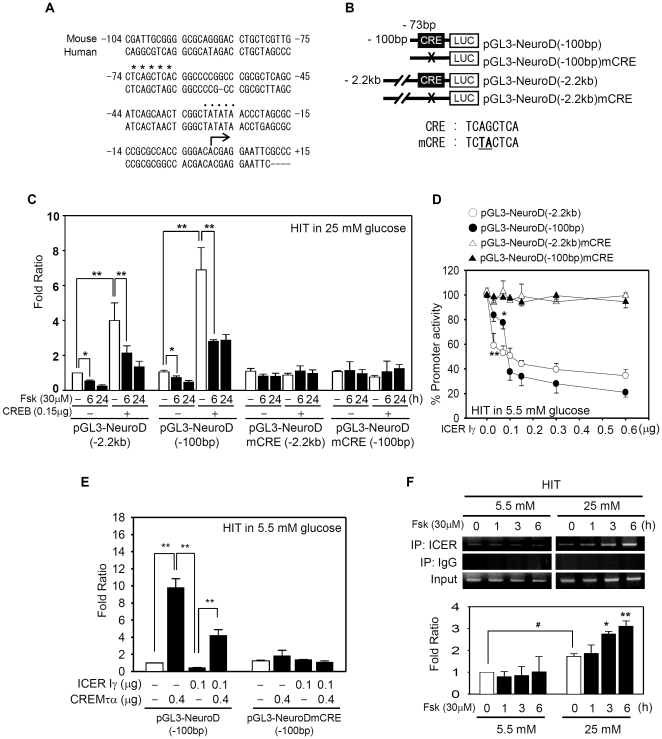
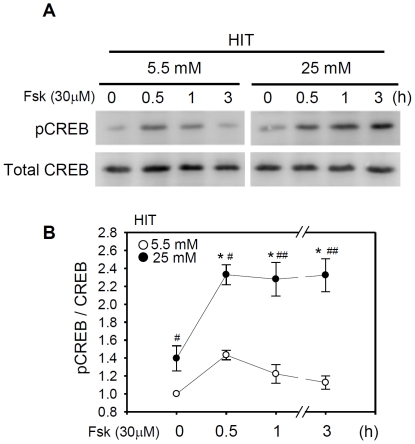
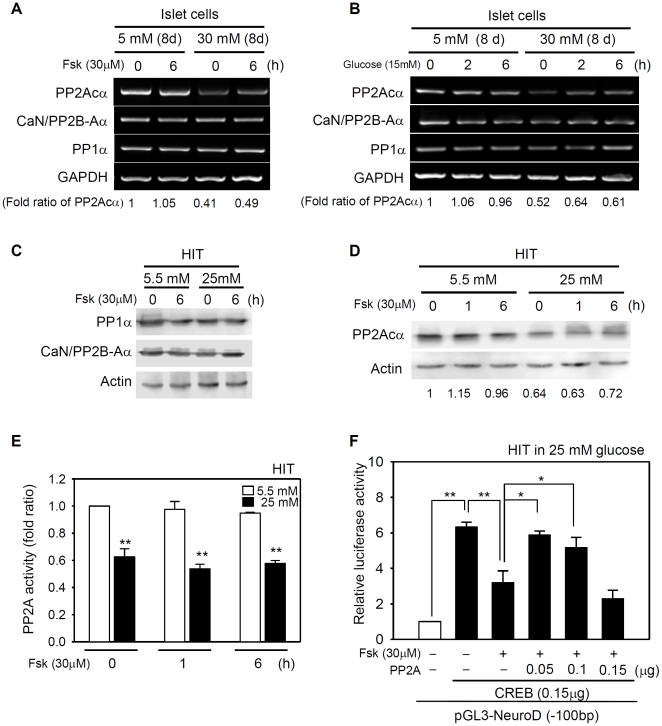
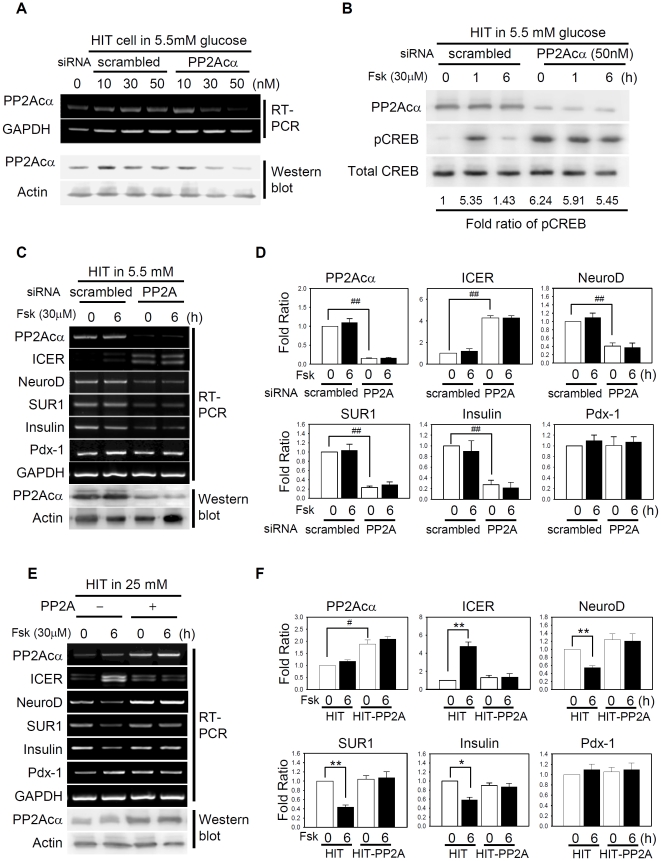
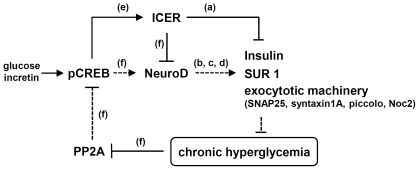
CREB mediates the transcriptional effects of glucose and incretin hormones in insulin-target cells and insulin-producing β-cells. Although the inhibition of CREB activity is known to decrease the β-cell mass, it is still unknown what factors inversely alter the CREB signaling pathway in β-cells. Here, we show that β-cell dysfunctions occurring in chronic hyperglycemia are not caused by simple inhibition of CREB activity but rather by the persistent activation of CREB due to decreases in protein phophatase PP2A. When freshly isolated rat pancreatic islets were chronically exposed to 25 mM (high) glucose, the PP2A activity was reduced with a concomitant increase in active pCREB. Brief challenges with 15 mM glucose or 30 µM forskolin after 2 hour fasting further increased the level of pCREB and consequently induced the persistent expression of ICER. The excessively produced ICER was sufficient to repress the transcription of NeuroD, insulin, and SUR1 genes. In contrast, when islets were grown in 5 mM (low) glucose, CREB was transiently activated in response to glucose or forskolin stimuli. Thus, ICER expression was transient and insufficient to repress those target genes. Importantly, overexpression of PP2A reversed the adverse effects of chronic hyperglycemia and successfully restored the transient activation of CREB and ICER. Conversely, depletion of PP2A with siRNA was sufficient to disrupt the negative feedback regulation of CREB and induce hyperglycemic phenotypes even under low glucose conditions. Our findings suggest that the failure of the negative feedback regulation of CREB is the primary cause for β-cell dysfunctions under conditions of pathogenic hyperglycemia, and PP2A can be a novel target for future therapies aiming to protect β-cells mass in the late transitional phase of non-insulin dependent type 2 diabetes (NIDDM).


Conflict of interest statement

Competing Interests: The authors have declared that no competing interests exist.

Figures

Figure 1
Figure 1. Chronic hyperglycemia alters the β-cell specific gene expression in pancreatic islets.
(A) Rat islet cells were cultured in the presence of 5 mM or 30 mM glucose for 8 days, and stimulated with 15 mM glucose for 0–6 h after 2 h preconditioning in 5 mM glucose. (B) Dithizone staining of islet cells after 8 days of culture. Scale bar: 100 µm. (C) In low (5 mM) glucose condition, insulin secretion was normal in response to acute stimulation with 15 mM glucose after 8 day culture whereas insulin secretion was impaired after 8-day exposure to high (30 mM) glucose. Under high glucose conditions, cellular insulin content were significantly reduced, and total proteins were decreased slightly. (D∼H) Real-time PCR was carried out using SYBR green to quantitate the mRNA levels of indicated genes in diverse conditions shown in A. Relative mRNA levels were estimated from of Ct values summarized in Supporting Table S1 using 2−ΔΔCt method. The data from three independent experiments are presented as average fold ratios (means ± S.E.) of relative mRNA expression compare with the 5 mM glucose-cultured islets before glucose stimulation. Simultaneous decreases in the mRNA levels and the intracellular insulin content correlated well. Significant effects of 15 mM glucose (*, P<0.05; **, P<0.01) or 8-day incubation in 30 mM glucose (#, P<0.05) are marked. Similar results were obtained with traditional, semi-quantitative methods (Supporting Figure S1).
Figure 2
Figure 2. Chronic hyperglycemia alters the responsiveness to cAMP in pancreatic islets.
(A) Rat islet cells were cultured in the presence of 5 mM or 30 mM glucose for 8 days and stimulated with 30 µM forskolin for 0–12 h after 2 h preconditioning in 5 mM glucose. (B∼F) Real-time PCR was carried out using SYBR green to quantitate the mRNA levels of indicated genes in diverse conditions shown in A. Relative mRNA levels were estimated from Ct values summarized in Supporting Table S1 using 2−ΔΔCt method. The data from three independent experiments are presented as average fold ratios of relative mRNA expression compare with the 5 mM glucose-cultured islets before forskolin treatment in 5 mM glucose-cultured islets. Significant effects of forskolin (*, P<0.05; **, P<0.01) or 8-day incubation in 30 mM glucose (#, P<0.05) are marked.
Figure 3
Figure 3. cAMP exerts similar effects in HIT cells after chronic exposure to hyperglycemia.
(A) HIT cells were grown in 5.5 mM (left panels) or 25 mM glucose (right panels) and treated with 30 µM forskolin for the indicated time. Semi-quantitative RT-PCR analysis revealed a transient (in 5.5 mM glucose) or a persistent (in 25 mM glucose) induction of two isoforms of ICER. (B) The mRNA level of each gene was normalized to that of GAPDH. Data from three independent experiments are presented as fold ratios with respect to the value obtained with 5.5 mM glucose in the absence of forskolin. Significant effects of forskolin (*, P<0.05; **, P<0.01) or chronic 25 mM glucose (#, P<0.05; ##, P<0.01) are marked.
Figure 4
Figure 4. ICER binds to a novel CRE sequence in the proximal NeuroD promoter.
(A) Comparison of the proximal promoters of mouse (gi:3641530) and human (gi:7416051) NeuroD. The mouse TATA box (••••) at −30 bp and a potential CRE site (****) at −73 bp from the transcription initiation site (the arrow) are conserved. (B) A schematic model of reporter genes with −100 bp or −2.2 kb fragment of NeuroD promoter. Sequences for a putative wild type CRE and mutated (mCRE) are shown. (C) Reporter genes with the wild type CRE or mCRE (0.4 µg) were cotransfected with the CREB expression vector (0.15 µg) into HIT cells grown in 25 mM glucose. Forskolin (30 µM) was added for the indicated time before harvesting. The average luciferase activity from three independent experiments was shown as the fold ratio with respect to the basal activity of the reporter gene without CREB overexpression and forskolin. (*, P<0.05; **, P<0.01). (D) ICER Iγ directly repressed in a dose dependent manner the NeuroD reporter genes (0.4 µg) only with the wild type CRE but not with a mCRE in HIT cells grown in 5.5 mM glucose. (E) HIT cells grown in 5.5 mM glucose were cotransfected with NeuroD reporter genes (0.4 µg) and expression vectors for CREM τα (0.4 µg) and/or ICER Iγ (0.1 µg). The relative luciferase activity from three independent experiments is presented as the fold ratio with respect to the value of indicated conditions. (F) ChIP assays were performed to detect direct binding of endogenous ICER to the NeuroD CRE sequence at −73 bp using HIT cells grown in 5.5 mM or 25 mM glucose after stimulation with 30 µM forskolin for the indicated time. Long-term culture in 25 mM glucose enhanced the binding of ICER to CRE (right panels). The absence of immunoprecipitated CRE with a nonspecific IgG verified the specificity of the assay. Results from three independent ChIP assays were semi-quantitatively measured and presented as fold ratios with respect to the value obtained without forskolin in 5.5 mM glucose. Significant effects of forskolin (*, P<0.05; **, P<0.01) or chronic high glucose (#, P<0.05) are marked.
Figure 5
Figure 5. Chronic hyperglycemia persistently activates the basal and forskolin-stimulated pCREB.
(A) HIT cells were incubated in the presence of 30 µM forskolin for the indicated time before harvesting. Western blot analysis was carried out with an antibody specific for CREB phosphorylated at Ser133 (pCREB). The membrane was re-probed with an anti-CREB antibody to determine the total amount of CREB. (B) Levels of pCREB were normalized to that of total CREB. Data from three independent western assays are presented as the fold ratios with respect to the value of HIT cells grown in 5.5 mM glucose in the absence of forskolin. Significant effects of forskolin (*, P<0.05; **, P<0.01) or chronic high glucose (#, P<0.05) are marked.
Figure 6
Figure 6. Chronic hyperglycemia reduces the PP2A level.
(A, B) Rat islet cells grown in 5 mM or 30 mM glucose were treated with 30 µM forskolin for 6 h (the same conditions as shown in Figure 2A). Alternatively rat islet cells grown in 5 mM or 30 mM glucose for 8 days were stimulated with 15 mM glucose for the indicated times (the same conditions as shown in Figure 1A). RT-PCR analysis was employed to determine the relative PP1α, PP2A Cα, and calcineurin/PP2B-Aα mRNA levels. The average values of PP2A Cα from three independent experiments are presented in the bottom of the gel as the relative ratios to the basal expression value in 5 mM glucose. (C, D) Western analysis performed with HIT cells grown in 5.5 mM or 25 mM glucose. PP1, PP2A, and PP2B level was normalized to that of actin. The average values from three independent experiments are presented in each lane as the relative ratio to the basal expression level in 5.5 mM glucose. (E) HIT cell lysates were immunoprecipitated with anti-PP2A antibody and subject to a standard phosphatase assay with a synthetic peptide. Data from three independent experiments are presented as fold ratios with respect to the value obtained in 5.5 mM glucose (**, P<0.01). (F) HIT cells grown in 25 mM glucose were cotransfected with 0.4 µg NeuroD reporter gene and 0.15 µg CREB expression vector, together with indicated amount of the PP2A Cα expression vector. Forskolin was added to a final concentration of 30 µM for 6 hour. The relative luciferase activity from three independent experiments is presented as the fold ratio with respect to the value of reporter gene alone (*, P<0.05; **, P<0.01).
Figure 7
Figure 7. Reduced activity of PP2A is the primary cause of impaired gene expression.
(A) HIT cells were transfected with the indicated amounts of PP2A Cα siRNA for 48 h. RNA was harvested and subjected to RT-PCR analysis or proteins subject to western analysis. Scrambled RNA was employed to validate the specificity of PP2A Cα-specific siRNA. (B) HIT cells grown in 5.5 mM glucose were transfected with 50 nM siRNA specific for PP2A Cα or with scrambled sequences. Prior to harvesting, 30 µM forskolin was added to the culture for 1–6 h. Western analysis was performed with anti-phospho CREB (pCREB Ser133) or PP2A Cα antibody, followed by antibody against total CREB. (C) RT-PCR analysis with HIT cells grown in 5.5 mM glucose indicated that PP2A Cα-specific siRNA altered the basal and forskolin-induced gene expression of ICER, NeuroD, SUR1, and insulin as shown in hyperglycemic conditions. (E) RT-PCR analysis with HIT cells stably overexpressing PP2A Cα. Overexpression of PP2A in HIT cells grown in 25 mM glucose restored the ICER, NeuroD, SUR1, and insulin to the values obtained in normoglycemic (5.5 mM) condition. (D, F) Data from three independent experiments shown in C, E are presented as fold ratios with respect to the value of scrambled siRNA or mock-transfected HIT cells (#, P<0.05; ##, P<0.05), and to the value of without forskolin (*, P<0.05; **, P<0.01).
Figure 8
Figure 8. ICER-mediated NeuroD repression aggravates vicious cycle of chronic hyperglycemia.
In normoglycemia, PP2A keeps the level of CREB below the physiological threshold and transient activation of CREB in response to glucose and incretin is not sufficient to induce persistent expression of ICER. In chronic hyperglycemia, CREB is constantly activated due to the decreased PP2A level. Upon glucose stimulation or hormonal cues, CREB is further activated for an extended period of time, leading to prolonged ICER induction. Consequently, excessively produced ICER proteins repress the NeuroD expression and the NeuroD's target genes including insulin, SUR1, and components of the exocytotic machinery. The hyperglycemic condition is progressively aggravated through this vicious negative cycle of insulin depletion, and ultimately progressed to β-cell failure. (a) Inada et al., 1999 ; Abderrahmani et al., 2006 ; (b) Naya et al., 1995 ; (c) Kim et al., 2002 ; (d) Ishizuka et al., 2007 , Gu et al., 2010 ; (e) Sassone-Corsi, 1998 ; and (f) this study. The active pathways in chronic hyperglycemia are presented as solid (—) lines, while the defective pathway as dashed (----) lines. Arrows indicate stimulatory effects, while blunt ends inhibitory effects.

Similar articles

Cited by

References

    1. Jonas JC, Bensellam M, Duprez J, Elouil H, Guiot Y, et al. Glucose regulation of islet stress responses and beta-cell failure in type 2 diabetes. Diabetes Obes Metab. 2009;11:65–81. - PubMed
    1. Chakrabarti SK, Mirmira RG. Transcription factors direct the development and function of pancreatic β cells. Trends Endocrinol Metab. 2003;14:78–84. - PubMed
    1. Habener JF, Kemp DM, Thomas MK. Minireview : Transcriptional regulation in pancreatic development. Endocrinol. 2005;146:1025–1034. - PubMed
    1. Naya FJ, Stellrecht CM, Tsai MJ. Tissue-specific regulation of the insulin gene by a novel basic helix-loop-helix transcription factor. Genes Dev. 1995;9:1009–1919. - PubMed
    1. Kim JW, Seghers V, Cho JH, Kang Y, Kim S, et al. Transactivation of the mouse sulfonylurea receptor I gene by BETA2/NeuroD. Mol Endocrinol. 2002;16:1097–1107. - PubMed

Publication types

MeSH terms