RAGE expression in human T cells: a link between environmental factors and adaptive immune responses
- PMID: 22509345
- PMCID: PMC3324532
- DOI: 10.1371/journal.pone.0034698
RAGE expression in human T cells: a link between environmental factors and adaptive immune responses
Abstract
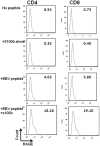
The Receptor for Advanced Glycation Endproducts (RAGE) is a scavenger ligand that binds glycated endproducts as well as molecules released during cell death such as S100b and HMGB1. RAGE is expressed on antigen presenting cells where it may participate in activation of innate immune responses but its role in adaptive human immune responses has not been described. We have found that RAGE is expressed intracellularly in human T cells following TCR activation but constitutively on T cells from patients with diabetes. The levels of RAGE on T cells from patients with diabetes are not related to the level of glucose control. It co-localizes to the endosomes. Its expression increases in activated T cells from healthy control subjects but bystander cells also express RAGE after stimulation of the antigen specific T cells. RAGE ligands enhance RAGE expression. In patients with T1D, the level of RAGE expression decreases with T cell activation. RAGE+ T cells express higher levels of IL-17A, CD107a, and IL-5 than RAGE- cells from the same individual with T1D. Our studies have identified the expression of RAGE on adaptive immune cells and a role for this receptor and its ligands in modulating human immune responses.
Conflict of interest statement
Figures


Similar articles
-
The Receptor for Advanced Glycation Endproducts Drives T Cell Survival and Inflammation in Type 1 Diabetes Mellitus.J Immunol. 2016 Oct 15;197(8):3076-3085. doi: 10.4049/jimmunol.1600197. Epub 2016 Sep 21. J Immunol. 2016. PMID: 27655844 Free PMC article.
-
The receptor for advanced glycation endproducts (RAGE) modulates T cell signaling.PLoS One. 2020 Sep 28;15(9):e0236921. doi: 10.1371/journal.pone.0236921. eCollection 2020. PLoS One. 2020. PMID: 32986722 Free PMC article.
-
Receptor for Advanced Glycation End Products (RAGE) in Type 1 Diabetes Pathogenesis.Curr Diab Rep. 2016 Oct;16(10):100. doi: 10.1007/s11892-016-0782-y. Curr Diab Rep. 2016. PMID: 27612847 Review.
-
Human eosinophils express RAGE, produce RAGE ligands, exhibit PKC-delta phosphorylation and enhanced viability in response to the RAGE ligand, S100B.Int Immunol. 2011 Dec;23(12):713-28. doi: 10.1093/intimm/dxr083. Epub 2011 Oct 24. Int Immunol. 2011. PMID: 22025532 Free PMC article.
-
Receptor Mediated Effects of Advanced Glycation End Products (AGEs) on Innate and Adaptative Immunity: Relevance for Food Allergy.Nutrients. 2022 Jan 15;14(2):371. doi: 10.3390/nu14020371. Nutrients. 2022. PMID: 35057553 Free PMC article. Review.
Cited by
-
Cell Based Therapy for Type 1 Diabetes: Should We Take Hyperglycemia Into Account?Front Immunol. 2019 Feb 5;10:79. doi: 10.3389/fimmu.2019.00079. eCollection 2019. Front Immunol. 2019. PMID: 30804929 Free PMC article. Review.
-
The receptor for advanced glycation end products (RAGE) affects T cell differentiation in OVA induced asthma.PLoS One. 2014 Apr 23;9(4):e95678. doi: 10.1371/journal.pone.0095678. eCollection 2014. PLoS One. 2014. PMID: 24759895 Free PMC article.
-
Divide, Conquer, and Sense: CD8+CD28- T Cells in Perspective.Front Immunol. 2017 Jan 3;7:665. doi: 10.3389/fimmu.2016.00665. eCollection 2016. Front Immunol. 2017. PMID: 28096804 Free PMC article.
-
Soluble Receptor for Advanced Glycation End Product Ameliorates Chronic Intermittent Hypoxia Induced Renal Injury, Inflammation, and Apoptosis via P38/JNK Signaling Pathways.Oxid Med Cell Longev. 2016;2016:1015390. doi: 10.1155/2016/1015390. Epub 2016 Sep 5. Oxid Med Cell Longev. 2016. PMID: 27688824 Free PMC article.
-
Analysis of changes in high-mobility group box 1, receptor for advanced glycation endproducts, and T helper 17/regulatory T balance in severe preeclampsia with acute heart failure.J Clin Hypertens (Greenwich). 2024 Apr;26(4):431-440. doi: 10.1111/jch.14784. Epub 2024 Mar 24. J Clin Hypertens (Greenwich). 2024. PMID: 38523455 Free PMC article.
References
-
- Nakayama T, Yamashita M. The TCR-mediated signaling pathways that control the direction of helper T cell differentiation. Semin Immunol. 2010;22:303–309. - PubMed
-
- Schneider R. T cells with commitment issues. Sci Signal. 2010;3:jc3. - PubMed
-
- Frauwirth KA, Riley JL, Harris MH, Parry RV, Rathmell JC, et al. The CD28 signaling pathway regulates glucose metabolism. Immunity. 2002;16:769–777. - PubMed
-
- Frauwirth KA, Thompson CB. Regulation of T lymphocyte metabolism. J Immunol. 2004;172:4661–4665. - PubMed
-
- Beverly B, Kang SM, Lenardo MJ, Schwartz RH. Reversal of in vitro T cell clonal anergy by IL-2 stimulation. Int Immunol. 1992;4:661–671. - PubMed
Publication types
MeSH terms
Substances
LinkOut - more resources
Full Text Sources
Medical
Miscellaneous

