. 2012 May 7;209(5):987-1000.
doi: 10.1084/jem.20111024. Epub 2012 Apr 16.

Human invariant natural killer T cells acquire transient innate responsiveness via histone H4 acetylation induced by weak TCR stimulation

Affiliations

Human invariant natural killer T cells acquire transient innate responsiveness via histone H4 acetylation induced by weak TCR stimulation

Xiaohua Wang et al. J Exp Med. .

Abstract

Invariant NKT cells (iNKT cells) are innate T lymphocytes that are thought to play an important role in producing an early burst of IFN-γ that promotes successful tumor immunosurveillance and antimicrobial immunity. The cellular activation processes underlying innate IFN-γ production remain poorly understood. We show here that weak T cell receptor (TCR) stimulation that does not directly activate iNKT cell IFN-γ messenger RNA transcription nevertheless induces histone H4 acetylation at specific regions near the IFNG gene locus. This renders the iNKT cells able to produce IFN-γ in an innate manner (i.e., not requiring concurrent TCR stimulation) upon exposure to IL-12 and IL-18. The iNKT cells retain the capacity for innate activation for hours to days after the initial weak TCR stimulation, although their innate responsiveness gradually declines as a function of histone deacetylation. These results explain how iNKT cells are able to mediate rapid innate IFN-γ secretion in a manner that does not require them to undergo permanent T(H1) differentiation. Moreover, our results also indicate that iNKT cell motility is maintained during activation by IL-12 and IL-18. Therefore, iNKT cells activated through this pathway can continue to migrate and may thus disseminate the IFN-γ that they produce, which may amplify its impact.


Figures
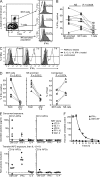
Figure 1.
Figure 1.
Autoantigenic stimulation primes iNKT cells for subsequent TCR-independent IFN-γ production. (A) Flow cytometric analysis of an experiment in which isolated human PBMCs were depleted of B cells, monocytes, and DCs and then incubated in medium alone (open histograms) or in medium containing a mixture of IL-12, IL-18, and IFN-α (closed histograms). The cells were stained with α-GalCer–loaded CD1d tetramer and anti-CD3 and then fixed, permeabilized, and stained for intracellular IFN-γ. Results shown are from one representative analysis out of eight. (B) Compiled results from analyses of eight different human peripheral blood samples, showing the percentage of the indicated cell populations in each sample that stained positively for IFN-γ after the treatment described in A. Horizontal bars indicate the mean. (C) Flow cytometric analysis showing the intracellular IFN-γ staining of the peripheral blood iNKT cell population of an unstimulated sample (light gray histograms) compared with a sample treated with IL-12, IL-18, and IFN-α (dark gray histograms) or PMA and ionomycin (dotted lines) at the indicated time points. Results are from one representative experiment out of three. (D) Compiled results from analyses of five different human peripheral blood samples for IFN-γ staining induced by IL-12, IL-18, and IFN-α. The first two plots show the fraction of cells positive for IFN-γ in the iNKT or NK-enriched subsets for freshly isolated samples (fresh) compared with that in samples that were rested for 5 d in the absence of APCs and then exposed to the cytokine mixture (after 5 d). The rightmost plot shows the fraction of iNKT cells compared with NK cells in each sample that retained the ability to produce IFN-γ after 5 d. (E) Cultured human iNKT cells are primed to produce innate IFN-γ by transient exposure to CD1d+ APCs. (top) The indicated iNKT clones were incubated with CD1d-transfected (CD1d+) or untransfected (CD1d) APCs, and production of the cytokines shown on the x axes was quantitated by ELISA. The dashed lines show the limit of detection of the ELISAs (5 pg/ml). (bottom) iNKT clones were exposed to the indicated APCs for 4 h, and then the APCs were removed. The purified iNKT cells were then incubated with CD1d APCs in medium containing IL-12 and IL-18, and cytokine secretion was quantitated by ELISA. Results are shown as the fold increase in cytokine production compared with iNKT cells that were not treated with IL-12 and IL-18 (IFN-γ concentrations were typically in the range of 0.2–2 ng/ml; for the purposes of these analyses, cytokine concentrations that were below the limit of detection of the ELISA were arbitrarily assigned a value of 1 pg/ml). The results shown are from a single experiment in which the indicated iNKT cell clones were tested in parallel; similar results were obtained in at least three additional experiments each for clones GG1.2, JC2.4, and PP1.10. Similar results were also obtained in multiple independent experiments using three additional human NKT cell clones (J3N.5, J24N.22, and GL1.4). (F) iNKT cells were exposed to CD1d+ APCs for 4 h, then the APCs were removed, and the iNKT cells were rested in medium for the indicated times and then exposed to IL-12 and IL-18. Results are expressed as the fold increase in cytokine secretion compared with control iNKT cells that were exposed to the APCs but not stimulated with IL-12 and IL-18. The results shown are representative of three independent analyses on two different iNKT cell clones.
Figure 2.
Figure 2.
Cytokine-induced IFN-γ production by autoantigen-primed iNKT cells does not require concurrent TCR signaling. (A) Cultured human iNKT cells were exposed to CD1d+ APCs in medium containing 50 µM of the MEK inhibitor U0126 or in medium alone (NT). The APCs and inhibitor were then removed, the iNKT cells were incubated in medium containing IL-12 and IL-18 for 16 h, and IFN-γ secreted into the culture supernatant was quantitated by ELISA. Results are representative of four independent experiments using three different iNKT cell clones. (B) Cultured iNKT cells that had been transiently exposed to CD1d+ APCs were incubated in medium containing IL-12 and IL-18 in the presence or absence of U0126. The plot shows the amount of IFN-γ secreted in the presence of the inhibitor as a percentage of that produced by control iNKT cells stimulated in the absence of U0126 (NT). Results are representative of four independent experiments using three different iNKT cell clones. (C) Effect of CsA on IFN-γ secretion by cultured iNKT cells exposed to IL-12 and IL-18 in the presence of CD1d+ APCs (concurrent) compared with primed iNKT cells during subsequent stimulation with IL-12 and IL-18. The plot shows IFN-γ secretion by treated iNKT cells as a fraction of the amount produced by control iNKT cells that were stimulated in the absence of CsA. Results are representative of four independent experiments using three different iNKT cell clones. (D) Cultured iNKT cells were exposed to CD1d+ APCs, then the APCs were removed, and the iNKT cells were exposed to IL-12 and IL-18 in the presence of the p38 inhibitors SB203580 or SB202190 or the inactive analogue SB202474 (mock). Results are representative of four independent experiments using three different iNKT cell clones. All plots show the means of three replicate samples, with error bars indicating the standard deviations of the means (not always visible on the scales shown).
Figure 3.
Figure 3.
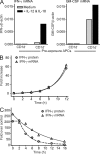
IL-12 and IL-18 stimulation induces IFN-γ mRNA transcription. (A) Real-time PCR analysis of IFN-γ or GM-CSF mRNA from cultured iNKT cells that were transiently exposed to CD1d or CD1d+ APCs and then stimulated with IL-12 and IL-18 or incubated in medium alone. Results are expressed as the signal obtained using IFN-γ or GM-CSF primers, divided by the signal from the same cDNA sample using β-actin primers. The plot shows one representative experiment out of three for a single iNKT cell clone; similar results were also obtained in independent experiments using two additional iNKT cell clones. (B) Kinetics of IFN-γ mRNA and protein production after IL-12 and IL-18 stimulation of cultured iNKT cells that were transiently exposed to CD1d+ APCs. Results are expressed as fold increase compared with control iNKT cells that were not stimulated with IL-12 and IL-18. The plot shows one representative experiment out of two; similar results were also obtained in two independent experiments using a different iNKT cell clone. (C) Real-time PCR analysis of IFN-γ mRNA in cultured iNKT cells that were first transiently exposed to CD1d+ APCs, then rested for the indicated times, and then stimulated with IL-12 and IL-18. Corresponding measurements of IFN-γ protein secretion from Fig. 2 A are shown for comparison. Results are expressed as fold increase over iNKT cells that were exposed to CD1d APCs in the first step. The plot shows one representative experiment out of two; similar results were also obtained in two independent experiments using a different iNKT cell clone.
Figure 4.
Figure 4.
IL-12 and IL-18 receptor expression and STAT-4 signaling. (A) Cultured iNKT cells were rested by incubation in medium lacking IL-2, then exposed to CD1d or CD1d+ APCs, and stained with antibodies against IL-12Rβ1 or IL-18R1 (solid gray histograms), compared with isotype-matched negative control antibodies (dotted lines). Results are from one representative experiment out of two; similar results were also obtained in two independent experiments using a different iNKT cell clone. (B) Rested iNKT cells were preexposed to CD1d or CD1d+ APCs, then the APCs were removed, and the iNKT cells were stimulated with the cytokine mixtures shown on the x axis or left unstimulated. The iNKT cells were fixed, permeabilized, and analyzed by flow cytometry for intracellular levels of phospho–STAT-4. The plot shows the increase in the median phospho–STAT-4 signal in cytokine-treated iNKT cells compared with those incubated in medium alone. The bars show the means of four independent analyses on two different iNKT cell clones, with error bars showing the standard deviations. mfi, mean fluorescence intensity.
Figure 5.
Figure 5.
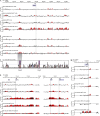
Induction of histone H4 acetylation at the IFNG locus. (A) Chromosomal DNA was prepared from naive or memory T cells isolated from human peripheral blood and from cells of a human iNKT clonal line that were either rested or stimulated with PMA and ionomycin and subject to ChIP-chip analysis of IFNG locus histone H4 acetylation. The tracks show log2 ratios of fluorescence from acetylated histone H4 immunoprecipitates compared with input DNA. Regions highlighted in red represent statistically significant signal (false discovery rate P < 0.05). Results shown are from a single analysis in which all of the samples were processed in parallel; similar results were obtained in two additional independent analyses. (B) Analysis of the IFNG locus of an iNKT clone that was rested (top track) compared with when it was exposed to CD1d+ APCs for 4 h (middle track). Shown on the bottom track is the net increase in acetylated histone H4 signal from the preexposed compared with the rested iNKT cells. Results shown are from one representative analysis out of three independent experiments. (C) mVista analysis of chromosomal sequence identity for this region of the human and mouse IFNG gene loci. Pink shaded areas indicate conserved noncoding sequences (CNS) identified by the mVista software, and blue shaded areas designate exons from the IFNG gene. The two areas highlighted in purple show regions that have been identified in the mouse IFNG gene locus as containing specific conserved noncoding sequences (mCNS1 or mCNS2) that have enhancer activity (Lee et al., 2004; Shnyreva et al., 2004). (D) ChIP-chip analysis of regions of chromosome 5 that contain genes encoding the cytokines IL-3 (IL3), GM-CSF (CSF2), IL-13 (IL13), and IL-4 (IL4). Results shown are from a single analysis in which all of the samples were processed in parallel; similar results were obtained in two additional independent analyses. (E) ChIP-chip analysis of the IL-2 locus. Results shown are from a single analysis in which all of the samples were processed in parallel; similar results were obtained in two additional independent analyses.
Figure 6.
Figure 6.
Dependence of IFN-γ production on histone acetylation. (A) Cultured iNKT cells were preexposed to CD1d+ APCs in the presence of vehicle alone or 11 µM HAT inhibitor dissolved in vehicle, then the APCs were removed, and the iNKT cells were washed and exposed to IL-12 and IL-18. IFN-γ secretion was measured by ELISA. The plot shows results from one representative experiment out of three; similar results were obtained in independent experiments using a different iNKT cell clone. Error bars indicate the standard deviations of the means. (B) Rested iNKT cells were left untreated (resting) or were exposed to CD1d+ APCs in the presence or absence of HAT inhibitor. The iNKT cells were fixed and lysed, and sheared chromatin was immunoprecipitated using an antibody against tetra-acetylated histone H4 (anti-H4Ac) or an isotype-matched negative control antibody (neg IgG), and the resulting purified DNA fragments were analyzed by quantitative PCR using primers that sit down in the region of the IFNG locus that is 18–25 kb downstream of the IFNG gene start site. Similar results were obtained with two additional primer pairs that localize to this region. (C) Compiled results from three independent experiments in which cultured iNKT cells were either preexposed to CD1d+ APCs or left untreated (resting). After removal of the APCs, the iNKT cells were either lysed immediately or after a 20-h incubation in culture medium. Immunoprecipitation was performed using an antibody against tetra-acetylated histone H4 (H4Ac) or with a negative control Ig, and PCR was performed using the same primers as in B. The PCR signals were normalized by the amount of input DNA for each condition, and the H4Ac enrichment was calculated by dividing the normalized signal from the H4Ac precipitate by that obtained from the negative control Ig precipitate. The plot shows the H4Ac enrichment from the indicated CD1d+ APC-pretreated iNKT cells as the fold over that obtained from the respective rested iNKT cells. Similar results were obtained in each case using a different set of primers that localize to this region. (D) Cultured iNKT cells were preexposed to CD1d-transfected APCs, then the APCs were removed, and the iNKT cells were incubated in the presence of medium alone or medium containing an HDAC inhibitor (TSA). After the indicated periods of time, IL-12 and IL-18 were added, and IFN-γ secretion was measured by ELISA. Results are expressed as the percentage of the amount produced when IL-12 and IL-18 were added immediately after removal of the APCs and are from one representative analysis out of three independent experiments. Similar results were obtained in three independent experiments on two additional iNKT cell clones. (E) Compiled results from four independent experiments in which rested iNKT cells were treated with TSA for 18 h or left untreated (control), and then the cells were washed and stimulated with IL-12 and IL-18, and secreted IFN-γ was quantitated by ELISA. The plot shows the amount of IFN-γ secreted by the indicated TSA-treated iNKT cells normalized by the amount secreted by the corresponding control iNKT cells. The horizontal bar indicates the mean. (F) Freshly isolated peripheral blood T cells depleted of CD1d+ cell populations were stimulated with IL-12, IL-18, and IFN-α and flow cytometrically analyzed for intracellular IFN-γ (dark gray histograms) compared with unstimulated cells (open histograms) or were incubated for 3 or 5 d in the presence or absence of the HDAC inhibitor TSA and then washed and similarly stimulated and analyzed for intracellular IFN-γ expression. Results are representative of four independent experiments performed using PBMCs isolated from two different donors.
Figure 7.
Figure 7.
iNKT cell motility during innate activation. (A) Fluorescently labeled iNKT cells from a clonal line were incubated with monocyte-derived DCs on ICAM-1–Fc-coated slides in the presence of medium alone or medium containing IL-12 and IL-18 or after the DCs had been pulsed with the strong TCR agonist α-GalCer, and microscopic images were taken once every 15 s. Single cell tracking analysis was performed using ImageJ software. The panels each show the movement traces of seven representative iNKT cell events over a period of 15 min, with the starting point for each event normalized to the center of the picture. Similar results were obtained in three independent experiments using two different iNKT cell clones. (B) The mean velocity for 20–30 different iNKT cells in each condition was calculated by dividing the distance traveled by the time. Horizontal bars within the datasets show the means; p-values shown at the top were calculated by one-way analysis of variance followed by an unpaired Student’s t test. Similar results were obtained in three independent experiments using two different iNKT cell clones. (C) Flow cytometric analysis of tightly adhered iNKT:DC conjugates. Fluorescently labeled iNKT cells from a clonal line and monocyte-derived DCs were coincubated for 24 h and then subjected to vigorous vortexing followed by flow cytometric analysis to determine the fraction of iNKT cells that had remained conjugated to the DCs. iNKT cells and untreated DCs were cultured in medium alone (medium) or in medium containing IL-12 and IL-18 (IL-12&IL-18), or iNKT cells were cultured with LPS-treated or α-GalCer–pulsed DCs as indicated. Each bar represents the mean conjugate frequency from three independent analyses, with error bars showing the standard deviations of the means. (D) Microscopic analysis of iNKT cells from a clonal line labeled with CFSE (green) incubated for 2 h with DCs labeled with DiD (red) under conditions corresponding to those described in C. Similar results were obtained in three independent experiments using two different iNKT cell clones.

Similar articles

Cited by

References

    1. Bannister A.J., Kouzarides T. 1995. CBP-induced stimulation of c-Fos activity is abrogated by E1A. EMBO J. 14:4758–4762 - PMC - PubMed
    1. Bendelac A., Bonneville M., Kearney J.F. 2001. Autoreactivity by design: innate B and T lymphocytes. Nat. Rev. Immunol. 1:177–186 10.1038/35105052 - DOI - PubMed
    1. Bishop K.A., Meyer M.B., Pike J.W. 2009. A novel distal enhancer mediates cytokine induction of mouse RANKl gene expression. Mol. Endocrinol. 23:2095–2110 10.1210/me.2009-0209 - DOI - PMC - PubMed
    1. Brennan P.J., Tatituri R.V., Brigl M., Kim E.Y., Tuli A., Sanderson J.P., Gadola S.D., Hsu F.F., Besra G.S., Brenner M.B. 2011. Invariant natural killer T cells recognize lipid self antigen induced by microbial danger signals. Nat. Immunol. 12:1202–1211 10.1038/ni.2143 - DOI - PMC - PubMed
    1. Brigl M., Brenner M.B. 2010. How invariant natural killer T cells respond to infection by recognizing microbial or endogenous lipid antigens. Semin. Immunol. 22:79–86 10.1016/j.smim.2009.10.006 - DOI - PubMed

Publication types

MeSH terms