Membrane association of the PTEN tumor suppressor: molecular details of the protein-membrane complex from SPR binding studies and neutron reflection
- PMID: 22505997
- PMCID: PMC3323581
- DOI: 10.1371/journal.pone.0032591
Membrane association of the PTEN tumor suppressor: molecular details of the protein-membrane complex from SPR binding studies and neutron reflection
Abstract
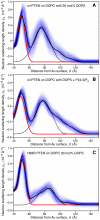
The structure and function of the PTEN phosphatase is investigated by studying its membrane affinity and localization on in-plane fluid, thermally disordered synthetic membrane models. The membrane association of the protein depends strongly on membrane composition, where phosphatidylserine (PS) and phosphatidylinositol diphosphate (PI(4,5)P(2)) act pronouncedly synergistic in pulling the enzyme to the membrane surface. The equilibrium dissociation constants for the binding of wild type (wt) PTEN to PS and PI(4,5)P(2) were determined to be K(d)∼12 µM and 0.4 µM, respectively, and K(d)∼50 nM if both lipids are present. Membrane affinities depend critically on membrane fluidity, which suggests multiple binding sites on the protein for PI(4,5)P(2). The PTEN mutations C124S and H93R show binding affinities that deviate strongly from those measured for the wt protein. Both mutants bind PS more strongly than wt PTEN. While C124S PTEN has at least the same affinity to PI(4,5)P(2) and an increased apparent affinity to PI(3,4,5)P(3), due to its lack of catalytic activity, H93R PTEN shows a decreased affinity to PI(4,5)P(2) and no synergy in its binding with PS and PI(4,5)P(2). Neutron reflection measurements show that the PTEN phosphatase "scoots" along the membrane surface (penetration <5 Å) but binds the membrane tightly with its two major domains, the C2 and phosphatase domains, as suggested by the crystal structure. The regulatory C-terminal tail is most likely displaced from the membrane and organized on the far side of the protein, ∼60 Å away from the bilayer surface, in a rather compact structure. The combination of binding studies and neutron reflection allows us to distinguish between PTEN mutant proteins and ultimately may identify the structural features required for membrane binding and activation of PTEN.
Conflict of interest statement
Figures


Similar articles
-
A mutant form of PTEN linked to autism.Protein Sci. 2010 Oct;19(10):1948-56. doi: 10.1002/pro.483. Protein Sci. 2010. PMID: 20718038 Free PMC article.
-
Membrane association of the PTEN tumor suppressor: electrostatic interaction with phosphatidylserine-containing bilayers and regulatory role of the C-terminal tail.J Struct Biol. 2012 Dec;180(3):394-408. doi: 10.1016/j.jsb.2012.10.003. Epub 2012 Oct 13. J Struct Biol. 2012. PMID: 23073177 Free PMC article.
-
Defining the membrane-associated state of the PTEN tumor suppressor protein.Biophys J. 2013 Feb 5;104(3):613-21. doi: 10.1016/j.bpj.2012.12.002. Biophys J. 2013. PMID: 23442912 Free PMC article.
-
Membrane association of the PTEN tumor suppressor: neutron scattering and MD simulations reveal the structure of protein-membrane complexes.Methods. 2015 May;77-78:136-46. doi: 10.1016/j.ymeth.2014.10.014. Epub 2014 Oct 27. Methods. 2015. PMID: 25461777 Free PMC article. Review.
-
Regulation of PTEN function as a PIP3 gatekeeper through membrane interaction.Cell Cycle. 2006 Jul;5(14):1523-7. doi: 10.4161/cc.5.14.3005. Epub 2006 Jul 17. Cell Cycle. 2006. PMID: 16861931 Review.
Cited by
-
Activation Mechanisms of the VPS34 Complexes.Cells. 2021 Nov 11;10(11):3124. doi: 10.3390/cells10113124. Cells. 2021. PMID: 34831348 Free PMC article. Review.
-
Opening the conformation is a master switch for the dual localization and phosphatase activity of PTEN.Sci Rep. 2015 Jul 28;5:12600. doi: 10.1038/srep12600. Sci Rep. 2015. PMID: 26216063 Free PMC article.
-
Coupling X-Ray Reflectivity and In Silico Binding to Yield Dynamics of Membrane Recognition by Tim1.Biophys J. 2017 Oct 3;113(7):1505-1519. doi: 10.1016/j.bpj.2017.08.003. Biophys J. 2017. PMID: 28978444 Free PMC article.
-
Phosphorylation-mediated PTEN conformational closure and deactivation revealed with protein semisynthesis.Elife. 2013 Jul 9;2:e00691. doi: 10.7554/eLife.00691. Elife. 2013. PMID: 23853711 Free PMC article.
-
Mechanism of human PTEN localization revealed by heterologous expression in Dictyostelium.Oncogene. 2014 Dec 11;33(50):5688-96. doi: 10.1038/onc.2013.507. Epub 2013 Dec 2. Oncogene. 2014. PMID: 24292679 Free PMC article.
References
Publication types
MeSH terms
Substances
Grants and funding
LinkOut - more resources
Full Text Sources
Research Materials
Miscellaneous

