

Low-density lipoprotein receptor deficiency causes impaired osteoclastogenesis and increased bone mass in mice because of defect in osteoclastic cell-cell fusion
- PMID: 22500026
- PMCID: PMC3365955
- DOI: 10.1074/jbc.M111.323600
Low-density lipoprotein receptor deficiency causes impaired osteoclastogenesis and increased bone mass in mice because of defect in osteoclastic cell-cell fusion
Abstract
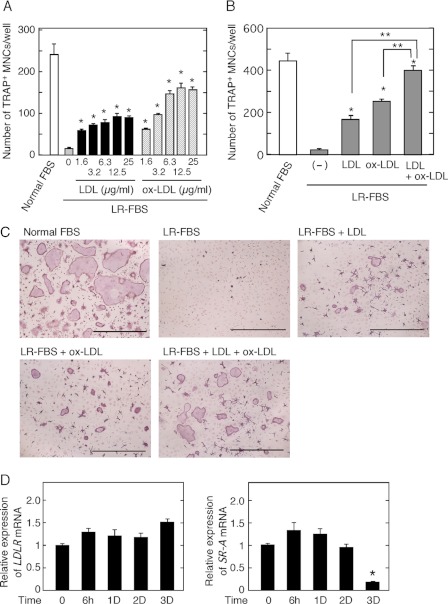
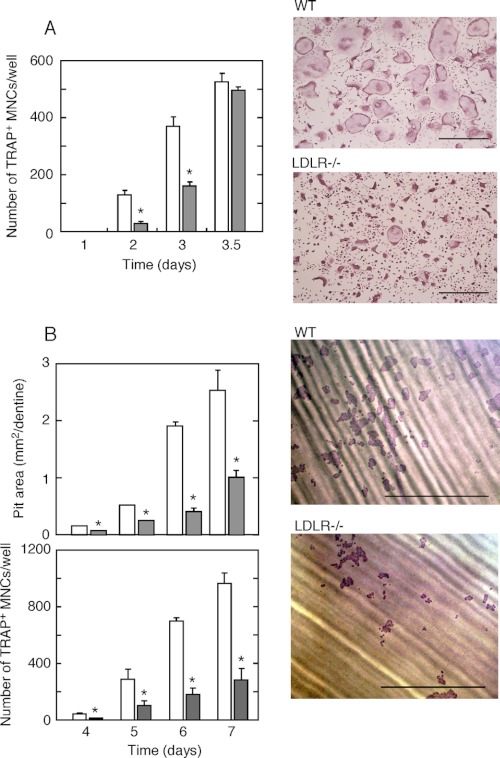
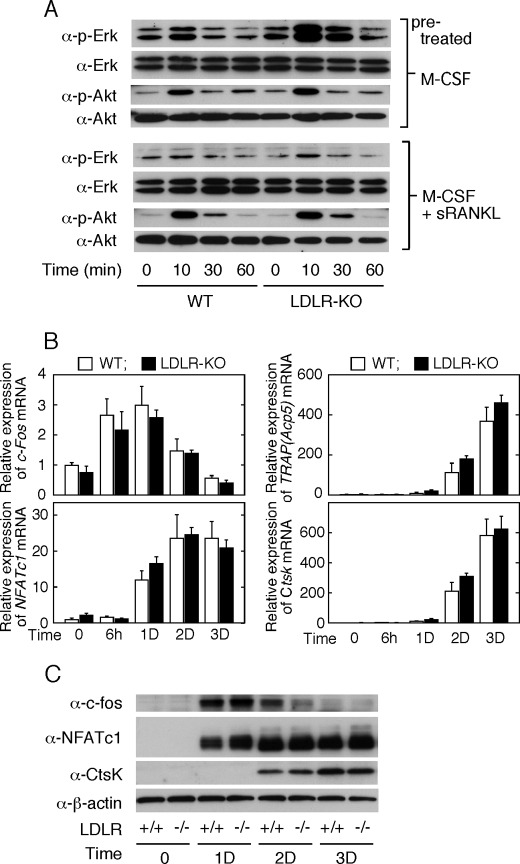
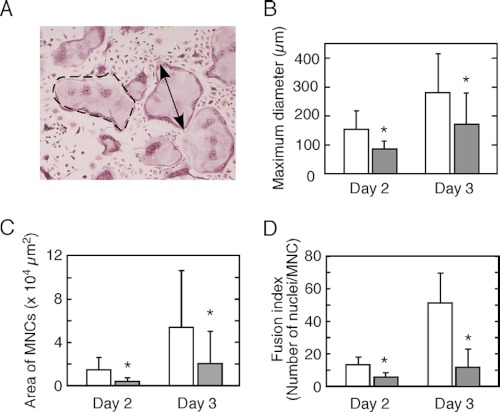
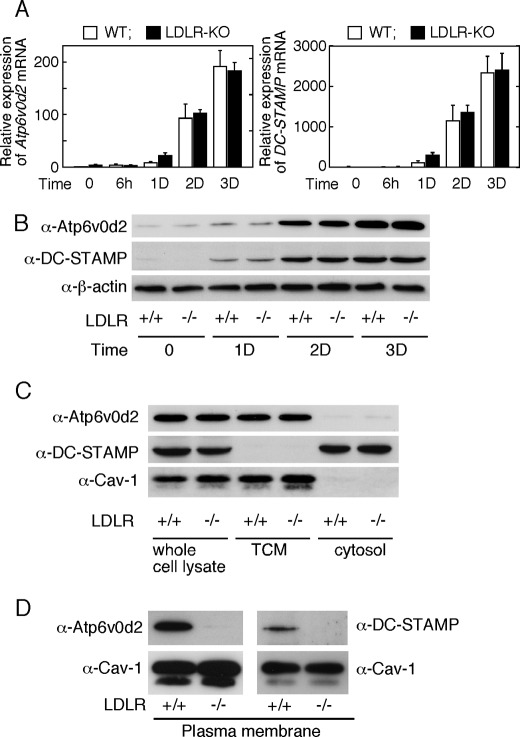
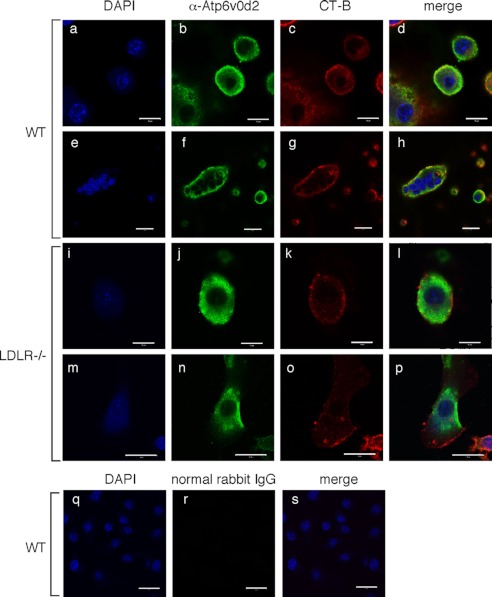
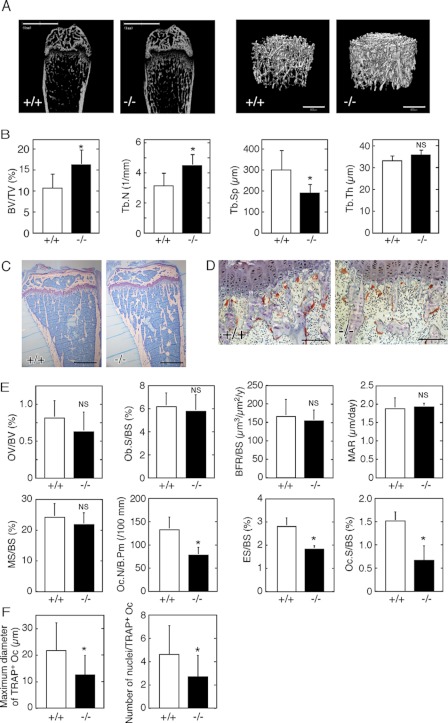
Osteoporosis is associated with both atherosclerosis and vascular calcification attributed to hyperlipidemia. However, the cellular and molecular mechanisms explaining the parallel progression of these diseases remain unclear. Here, we used low-density lipoprotein receptor knockout (LDLR(-/-)) mice to elucidate the role of LDLR in regulating the differentiation of osteoclasts, which are responsible for bone resorption. Culturing wild-type osteoclast precursors in medium containing LDL-depleted serum decreased receptor activator of NF-κB ligand (RANKL)-induced osteoclast formation, and this defect was additively rescued by simultaneous treatment with native and oxidized LDLs. Osteoclast precursors constitutively expressed LDLR in a RANKL-independent manner. Osteoclast formation from LDLR(-/-) osteoclast precursors was delayed, and the multinucleated cells formed in culture were smaller and contained fewer nuclei than wild-type cells, implying impaired cell-cell fusion. Despite these findings, RANK signaling, including the activation of Erk and Akt, was normal in LDLR(-/-) preosteoclasts, and RANKL-induced expression of NFATc1 (a master regulator of osteoclastogenesis), cathepsin K, and tartrate-resistant acid phosphatase was equivalent in LDLR-null and wild-type cells. In contrast, the amounts of the osteoclast fusion-related proteins v-ATPase V(0) subunit d2 and dendritic cell-specific transmembrane protein in LDLR(-/-) plasma membranes were reduced when compared with the wild type, suggesting a correlation with impaired cell-cell fusion, which occurs on the plasma membrane. LDLR(-/-) mice consistently exhibited increased bone mass in vivo. This change was accompanied by decreases in bone resorption parameters, with no changes in bone formation parameters. These findings provide a novel mechanism for osteoclast differentiation and improve the understanding of the correlation between osteoclast formation and lipids.
Figures
Similar articles
-
New mechanistic understanding of osteoclast differentiation and bone resorption mediated by P2X7 receptors and PI3K-Akt-GSK3β signaling.Cell Mol Biol Lett. 2024 Jul 8;29(1):100. doi: 10.1186/s11658-024-00614-5. Cell Mol Biol Lett. 2024. PMID: 38977961 Free PMC article.
-
PDK1 is important lipid kinase for RANKL-induced osteoclast formation and function via the regulation of the Akt-GSK3β-NFATc1 signaling cascade.J Cell Biochem. 2020 Nov;121(11):4542-4557. doi: 10.1002/jcb.29677. Epub 2020 Feb 12. J Cell Biochem. 2020. PMID: 32048762
-
The inhibitory effect and the molecular mechanism of glabridin on RANKL-induced osteoclastogenesis in RAW264.7 cells.Int J Mol Med. 2012 Feb;29(2):169-77. doi: 10.3892/ijmm.2011.822. Epub 2011 Oct 31. Int J Mol Med. 2012. PMID: 22038020
-
Systemic Activation of Activin A Signaling Causes Chronic Kidney Disease-Mineral Bone Disorder.Int J Mol Sci. 2018 Aug 23;19(9):2490. doi: 10.3390/ijms19092490. Int J Mol Sci. 2018. PMID: 30142896 Free PMC article. Review.
-
Roles of Wnt signals in bone resorption during physiological and pathological states.J Mol Med (Berl). 2013 Jan;91(1):15-23. doi: 10.1007/s00109-012-0974-0. Epub 2012 Oct 31. J Mol Med (Berl). 2013. PMID: 23111637 Review.
Cited by
-
Modulation of Bone and Marrow Niche by Cholesterol.Nutrients. 2019 Jun 21;11(6):1394. doi: 10.3390/nu11061394. Nutrients. 2019. PMID: 31234305 Free PMC article. Review.
-
The Roles of Fibrinolytic Factors in Bone Destruction Caused by Inflammation.Cells. 2024 Mar 15;13(6):516. doi: 10.3390/cells13060516. Cells. 2024. PMID: 38534360 Free PMC article. Review.
-
Leishmania infection-induced multinucleated giant cell formation via upregulation of ATP6V0D2 expression.Front Cell Infect Microbiol. 2022 Sep 23;12:953785. doi: 10.3389/fcimb.2022.953785. eCollection 2022. Front Cell Infect Microbiol. 2022. PMID: 36211967 Free PMC article.
-
Low density lipoprotein adsorption on a titanium surface and its effect on osteoblast behaviors.RSC Adv. 2019 Jun 12;9(32):18589-18598. doi: 10.1039/c9ra03173a. eCollection 2019 Jun 10. RSC Adv. 2019. PMID: 35515248 Free PMC article.
-
Lrp1 in osteoblasts controls osteoclast activity and protects against osteoporosis by limiting PDGF-RANKL signaling.Bone Res. 2018 Feb 26;6:4. doi: 10.1038/s41413-017-0006-3. eCollection 2018. Bone Res. 2018. PMID: 29507818 Free PMC article.
References
-
- Kurihara N., Suda T., Miura Y., Nakauchi H., Kodama H., Hiura K., Hakeda Y., Kumegawa M. (1989) Generation of osteoclasts from isolated hematopoietic progenitor cells. Blood 74, 1295–1302 - PubMed
-
- Suda T., Udagawa N., Nakamura I., Miyaura C., Takahashi N. (1995) Modulation of osteoclast differentiation by local factors. Bone 17, 87S-91S - PubMed
-
- Roodman G. D. (1996) Advances in bone biology. the osteoclast. Endocr. Rev. 17, 308–332 - PubMed
-
- Rodan S. B., Rodan G. A. (1997) Integrin function in osteoclasts. J. Endocrinol. 154, S47–56 - PubMed
Publication types
MeSH terms
Substances
LinkOut - more resources
Full Text Sources
Other Literature Sources
Medical
Molecular Biology Databases
Miscellaneous
