Develop and test a solvent accessible surface area-based model in conformational entropy calculations
- PMID: 22497310
- PMCID: PMC3360827
- DOI: 10.1021/ci300064d
Develop and test a solvent accessible surface area-based model in conformational entropy calculations
Abstract
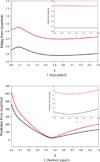
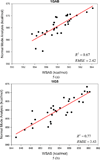
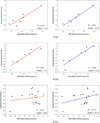
It is of great interest in modern drug design to accurately calculate the free energies of protein-ligand or nucleic acid-ligand binding. MM-PBSA (molecular mechanics Poisson-Boltzmann surface area) and MM-GBSA (molecular mechanics generalized Born surface area) have gained popularity in this field. For both methods, the conformational entropy, which is usually calculated through normal-mode analysis (NMA), is needed to calculate the absolute binding free energies. Unfortunately, NMA is computationally demanding and becomes a bottleneck of the MM-PB/GBSA-NMA methods. In this work, we have developed a fast approach to estimate the conformational entropy based upon solvent accessible surface area calculations. In our approach, the conformational entropy of a molecule, S, can be obtained by summing up the contributions of all atoms, no matter they are buried or exposed. Each atom has two types of surface areas, solvent accessible surface area (SAS) and buried SAS (BSAS). The two types of surface areas are weighted to estimate the contribution of an atom to S. Atoms having the same atom type share the same weight and a general parameter k is applied to balance the contributions of the two types of surface areas. This entropy model was parametrized using a large set of small molecules for which their conformational entropies were calculated at the B3LYP/6-31G* level taking the solvent effect into account. The weighted solvent accessible surface area (WSAS) model was extensively evaluated in three tests. For convenience, TS values, the product of temperature T and conformational entropy S, were calculated in those tests. T was always set to 298.15 K through the text. First of all, good correlations were achieved between WSAS TS and NMA TS for 44 protein or nucleic acid systems sampled with molecular dynamics simulations (10 snapshots were collected for postentropy calculations): the mean correlation coefficient squares (R²) was 0.56. As to the 20 complexes, the TS changes upon binding; TΔS values were also calculated, and the mean R² was 0.67 between NMA and WSAS. In the second test, TS values were calculated for 12 proteins decoy sets (each set has 31 conformations) generated by the Rosetta software package. Again, good correlations were achieved for all decoy sets: the mean, maximum, and minimum of R² were 0.73, 0.89, and 0.55, respectively. Finally, binding free energies were calculated for 6 protein systems (the numbers of inhibitors range from 4 to 18) using four scoring functions. Compared to the measured binding free energies, the mean R² of the six protein systems were 0.51, 0.47, 0.40, and 0.43 for MM-GBSA-WSAS, MM-GBSA-NMA, MM-PBSA-WSAS, and MM-PBSA-NMA, respectively. The mean rms errors of prediction were 1.19, 1.24, 1.41, 1.29 kcal/mol for the four scoring functions, correspondingly. Therefore, the two scoring functions employing WSAS achieved a comparable prediction performance to that of the scoring functions using NMA. It should be emphasized that no minimization was performed prior to the WSAS calculation in the last test. Although WSAS is not as rigorous as physical models such as quasi-harmonic analysis and thermodynamic integration (TI), it is computationally very efficient as only surface area calculation is involved and no structural minimization is required. Moreover, WSAS has achieved a comparable performance to normal-mode analysis. We expect that this model could find its applications in the fields like high throughput screening (HTS), molecular docking, and rational protein design. In those fields, efficiency is crucial since there are a large number of compounds, docking poses, or protein models to be evaluated. A list of acronyms and abbreviations used in this work is provided for quick reference.
Figures


Similar articles
-
Assessing the performance of MM/PBSA and MM/GBSA methods. 7. Entropy effects on the performance of end-point binding free energy calculation approaches.Phys Chem Chem Phys. 2018 May 30;20(21):14450-14460. doi: 10.1039/c7cp07623a. Phys Chem Chem Phys. 2018. PMID: 29785435
-
Assessing the performance of the MM/PBSA and MM/GBSA methods. 1. The accuracy of binding free energy calculations based on molecular dynamics simulations.J Chem Inf Model. 2011 Jan 24;51(1):69-82. doi: 10.1021/ci100275a. Epub 2010 Nov 30. J Chem Inf Model. 2011. PMID: 21117705 Free PMC article.
-
Assessing the performance of the MM/PBSA and MM/GBSA methods. 6. Capability to predict protein-protein binding free energies and re-rank binding poses generated by protein-protein docking.Phys Chem Chem Phys. 2016 Aug 10;18(32):22129-39. doi: 10.1039/c6cp03670h. Phys Chem Chem Phys. 2016. PMID: 27444142
-
The MM/PBSA and MM/GBSA methods to estimate ligand-binding affinities.Expert Opin Drug Discov. 2015 May;10(5):449-61. doi: 10.1517/17460441.2015.1032936. Epub 2015 Apr 2. Expert Opin Drug Discov. 2015. PMID: 25835573 Free PMC article. Review.
-
Development and test of highly accurate endpoint free energy methods. 1: Evaluation of ABCG2 charge model on solvation free energy prediction and optimization of atom radii suitable for more accurate solvation free energy prediction by the PBSA method.J Comput Chem. 2023 May 30;44(14):1334-1346. doi: 10.1002/jcc.27089. Epub 2023 Feb 21. J Comput Chem. 2023. PMID: 36807356 Review.
Cited by
-
Predicted Hotspot Residues Involved in Allosteric Signal Transmission in Pro-Apoptotic Peptide-Mcl1 Complexes.Biomolecules. 2020 Jul 28;10(8):1114. doi: 10.3390/biom10081114. Biomolecules. 2020. PMID: 32731448 Free PMC article.
-
In Silico Prediction and Validation of CB2 Allosteric Binding Sites to Aid the Design of Allosteric Modulators.Molecules. 2022 Jan 11;27(2):453. doi: 10.3390/molecules27020453. Molecules. 2022. PMID: 35056767 Free PMC article.
-
Investigating the Molecular Interactions of Quinoline Derivatives for Antibacterial Activity Against Bacillus subtilis: Computational Biology and In Vitro Study Interpretations.Mol Biotechnol. 2024 Nov;66(11):3252-3273. doi: 10.1007/s12033-023-00933-6. Epub 2023 Nov 6. Mol Biotechnol. 2024. PMID: 37930509
-
Novel compounds that specifically bind and modulate MscL: insights into channel gating mechanisms.FASEB J. 2019 Mar;33(3):3180-3189. doi: 10.1096/fj.201801628R. Epub 2018 Oct 25. FASEB J. 2019. PMID: 30359098 Free PMC article.
-
Protein-Protein Binding Free Energy Predictions with the MM/PBSA Approach Complemented with the Gaussian-Based Method for Entropy Estimation.ACS Omega. 2022 Mar 22;7(13):11057-11067. doi: 10.1021/acsomega.1c07037. eCollection 2022 Apr 5. ACS Omega. 2022. PMID: 35415339 Free PMC article.
References
-
- Kollman PA, Massova I, Reyes C, Kuhn B, Huo S, Chong L, Lee M, Lee T, Duan Y, Wang W, Donini O, Cieplak P, Srinivasan J, Case DA, Cheatham TE., III Calculating structures and free energies of complex molecules: Combining molecular mechanics and continuum models. Acc. Chem. Res. 2000;33:889–897. - PubMed
-
- Wang JM, Hou TJ, Xu XJ. Recent Advances in Free Energy Calculations with a Combination of Molecular Mechanics and Continuum Models. Curr. Comput.-Aided Drug Des. 2006;2:287–306.
-
- Jorgensen WL. Free-Energy Calculations - A breakthrough for modeling organic-chemistry in solution. Acc. Chem. Res. 1989;22:184–189.
-
- Beveridge DL, Dicapua FM. Free-energy via molecular simulation - applications to chemical and biomolecular systems. Annu. Rev. Biophys. Biophys. Chem. 1989;18:431–492. - PubMed
Publication types
MeSH terms
Substances
Grants and funding
LinkOut - more resources
Full Text Sources
Research Materials

