. 2012 May 18;287(21):17672-17681.
doi: 10.1074/jbc.M112.341354. Epub 2012 Apr 5.

Involvement of phosphoinositide 3-kinase and PTEN protein in mechanism of activation of TRPC6 protein in vascular smooth muscle cells

Affiliations

Involvement of phosphoinositide 3-kinase and PTEN protein in mechanism of activation of TRPC6 protein in vascular smooth muscle cells

Michaël Monet et al. J Biol Chem. .

Abstract

TRPC6 is a cation channel in the plasma membrane that plays a role in Ca(2+) entry after the stimulation of a G(q)-protein-coupled or tyrosine-kinase receptor. TRPC6 translocates to the plasma membrane upon stimulation and remains there as long as the stimulus is present. However, the mechanism that regulates the trafficking and activation of TRPC6 are unclear. In this study we showed phosphoinositide 3-kinase and its antagonistic phosphatase, PTEN, are involved in the activation of TRPC6. The inhibition of PI3K by PIK-93, LY294002, or wortmannin decreased carbachol-induced translocation of TRPC6 to the plasma membrane and carbachol-induced net Ca(2+) entry into T6.11 cells. Conversely, a reduction of PTEN expression did not affect carbachol-induced externalization of TRPC6 but increased Ca(2+) entry through TRPC6 in T6.11 cells. We also showed that the PI3K/PTEN pathway regulates vasopressin-induced translocation of TRPC6 to the plasma membrane and vasopressin-induced Ca(2+) entry into A7r5 cells, which endogenously express TRPC6. In summary, we provided evidence that the PI3K/PTEN pathway plays an important role in the translocation of TRPC6 to the plasma membrane and may thus have a significant impact on Ca(2+) signaling in cells that endogenously express TRPC6.


Figures
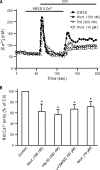
FIGURE 1.
FIGURE 1.
The inhibition of PI3K decreases CCh-induced Ca2+ entry into TRPC6-expressing HEK293 cells. A, [Ca2+]i in T6.11 cells loaded with fura-2 is shown. Cells were pretreated with 300 nm PIK-93 (open triangles), 100 nm wortmannin (close triangles), 10 μm wortmannin (open squares), or DMSO (closed circles) for 20 min before being stimulated with 5 μm CCh. The cells were incubated in the absence of extracellular Ca2+ (in the presence of 0.5 mm EGTA) for 30 s before adding the CCh. External Ca2+ (1.8 mm) was restored after 180 s. The graphs represent the average of 75 to 89 cells from a typical experiment (n = 3). B, maximum net CCh-induced Ca2+ entry values were calculated by subtracting the basal [Ca2+]i value (average of three values before Ca2+ restoration) from the average of three maximal [Ca2+]i values after Ca2+ restoration. The histogram represents the average ± S.D. of three independent experiments. *, p < 0.01.
FIGURE 2.
FIGURE 2.
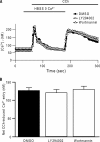
The inhibition of PI3K with LY294002 or wortmannin does not affect CCh-induced Ca2+ entry into HEK-AT1 cells. A, HEK293 cells overexpressing AT1R were used as a negative control for TRPC6 expression and were treated and stimulated as described in Fig. 1. The graphs represent the average of 405 cells for each condition from three independent experiments. B, net Ca2+ entry values were calculated and graphed as the averages ± S.D. of three independent experiments.
FIGURE 3.
FIGURE 3.
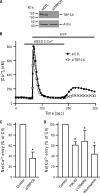
AVP-induced Ca2+ entry into A7r5 cells is inhibited by TRPC6 silencing and by the inhibition of PI3K. A, A7r5 cells were transfected with a 50 nm concentration of a mix of three siRNAs specific for TRPC6 (siTRPC6) or with a universal negative control (siCTL). After 48 h, the cells were solubilized, and the presence of TRPC6 (upper panel) or actin (lower panel) in the lysates was determined by Western blotting. B, A7r5 cells were transfected with siTRPC6 (open squares) or a universal negative control (closed squares). After 48 h, fura-2-loaded transfected cells were incubated in the absence of extracellular Ca2+ (in the presence of 0.5 mm EGTA) for 30 s and were then stimulated with 100 nm AVP. External Ca2+ (1.8 mm) was restored after 180 s. The graphs represent the average of 45 cells from a typical experiment (n = 5). C, maximum net AVP-induced Ca2+ entry in siTRPC6 and siCTL-transfected A7r5 cells were calculated by subtracting the basal [Ca2+]i value (average of three values before Ca2+ restoration) from the average of three maximal [Ca2+]i values after Ca2+ restoration. The histogram represents the average ± S.D. of three independent experiments. *, p < 0.01. Ctl, control. D, maximum net AVP-induced Ca2+ entry in A7r5 cells treated with PI3K inhibitors was calculated by subtracting the basal [Ca2+]i value (average of three values before Ca2+ restoration) from the average of three maximal [Ca2+]i values after Ca2+ restoration. The histogram represents the average ± S.D. of three independent experiments. *, p < 0.05.
FIGURE 4.
FIGURE 4.
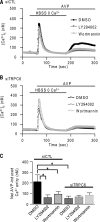
AVP-induced Ca2+ entry into siTRPC6-transfected A7r5 cells is unaffected by PI3K inhibitors. A7r5 cells were transfected with siCTL (A) or siTRPC6 (B). After 48 h, fura-2-loaded transfected cells were pretreated with 50 μm LY294002 (gray circles), 10 μm wortmannin (light gray triangles), or DMSO (black circles) for 20 min before being stimulated. Graphs represent the average of 135 cells for each condition from three independent experiments. C, net Ca2+ entry was calculated by subtracting the [Ca2+]i value determined by the average of three values measured just before adding 1.8 mm extracellular Ca2+ from the average of three [Ca2+]i values measured 55–65 s after the addition of extracellular Ca2+. Results are expressed as the means ± S.D. of three independent experiments. *, p < 0.01.
FIGURE 5.
FIGURE 5.
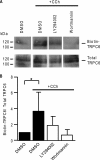
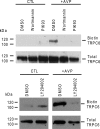
The increase in the cell surface expression of TRPC6 induced by CCh is abolished by the inhibition of PI3K. A, T6.11 cells were pretreated with 50 μm LY294002, 10 μm wortmannin, or DMSO for 20 min before being stimulated or not with 5 μm CCh for 5 min at 37 °C. The cells were then chilled, biotinylated with sulfo-NHS-SS-biotin, lysed, and incubated with streptavidin-agarose beads as described under “Experimental Procedures.” Proteins precipitated by streptavidin-agarose were separated by SDS-PAGE, and the presence of TRPC6 was detected by Western blotting using an anti-HA antibody (top). Aliquots (4%) of the cell lysates were collected before the incubation with streptavidin-agarose and were analyzed directly by immunoblotting to determine the total amount of TRPC6 in the samples (bottom). B, the immunoblots in A were scanned, and TRPC6 bands were quantified using ImageJ software. The biotinylated-TRPC6/total TRPC6 ratios were graphed relative to unstimulated control cells (DMSO). Results are expressed as the means ± S.D. of three independent experiments. *, p < 0.05.
FIGURE 6.
FIGURE 6.
The increase in the cell surface expression of TRPC6 induced by AVP is abolished by the inhibition of PI3K in A7r5 cells. A7r5 cells were pretreated with 300 nm PIK-93, 100 nm wortmannin, 50 μm LY294002, or DMSO for 20 min before being stimulated or not with AVP 100 nm. The cells were then chilled, biotinylated with sulfo-NHS-SS-biotin, lysed, and incubated with streptavidin-agarose beads as described under “Experimental Procedures.” Proteins precipitated by streptavidin-agarose were separated by SDS-PAGE, and the presence of TRPC6 was detected by Western blotting using an anti-TRPC6 antibody (top). Aliquots (4%) of the cell lysates were collected before the incubation with streptavidin-agarose and were analyzed directly by immunoblotting to determine the total amount of TRPC6 in the samples (bottom).
FIGURE 7.
FIGURE 7.
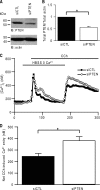
PTEN silencing potentiates CCh-induced Ca2+ entry into T6.11 cells. A, T6.11 cells were transfected with 50 nm concentrations of a mix of three siRNA specific for PTEN (siPTEN) or a universal negative control (siCTL). After 48 h, the cells were solubilized, and the presence of PTEN (upper panel) or actin (lower panel) in the lysates was determined by Western blotting (IB). B, the immunoblots from A were scanned, and the PTEN bands were quantified using ImageJ software. The PTEN/actin ratios were graphed relative to siCTL control cells. The results are expressed as the means ± S.D. of three independent experiments. C, T6.11 cells were transfected with siPTEN (open diamonds) or a universal negative control (closed squares). After 48 h, fura-2-loaded transfected cells were incubated in the absence of extracellular Ca2+ (in the presence of 0.5 mm EGTA) for 30 s and were then stimulated with 5 μm CCh. External Ca2+ (1.8 mm) was restored after 180 s. The graphs represent the average of 405 cells for each condition from three independent experiments. D, the net Ca2+ entry was calculated by subtracting the [Ca2+]i value determined from the average of three values measured just before adding 1.8 mm extracellular Ca2+ from the average of three [Ca2+]i values measured 12–22 s after the addition of extracellular Ca2+. Results are expressed as the means ± S.D. of three independent experiments. *, p < 0.01.
FIGURE 8.
FIGURE 8.
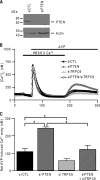
PTEN silencing potentiates AVP-induced Ca2+ entry into TRPC6-expressing cells. A, A7r5 cells were transfected with 50 nm of a mix of three siRNA specific for PTEN (siPTEN) or a universal negative control (siCTL). After 48 h, the cells were solubilized, and the quantity of PTEN (upper panel) or actin (lower panel) in the lysates was determined by Western blotting. B, A7r5 cells were transfected with siPTEN alone (gray circles), siTRPC6 alone (light gray triangles), siPTEN/siTRPC6 (open triangles), or siCTL alone (closed squares). After 48 h, the fura-2-loaded transfected cells were incubated in the absence of extracellular Ca2+ (in the presence of 0.5 mm EGTA) for 30 s and were then stimulated with 100 nm AVP. External Ca2+ (1.8 mm) was restored after 180 s. The graphs represent the average of 135 cells for each condition from three independent experiments. C, net Ca2+ entry was calculated by subtracting the [Ca2+]i value calculated from the average of three values measured just before adding 1.8 mm extracellular Ca2+ from the average of three [Ca2+]i values measured 41–51 s after the addition of extracellular Ca2+. Results are expressed as the means ± S.D. of three independent experiments. *, p < 0.02.
FIGURE 9.
FIGURE 9.
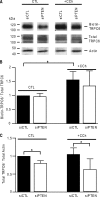
PTEN silencing does not affect the increase in the cell surface expression of TRPC6 induced by CCh in T6.11 cells. A, T6.11 cells were transfected with a 50 nm mix of three siRNA specific for PTEN (siPTEN) or a universal negative control (siCTL). After 48 h, the cells were stimulated or not with 5 μm CCh. The cells were then chilled, biotinylated with sulfo-NHS-SS-biotin, lysed, and incubated with streptavidin-agarose beads as described under “Experimental Procedures.” Proteins precipitated by the streptavidin-agarose were separated by SDS-PAGE, and the presence of TRPC6 was detected using an anti-HA antibody (top). Aliquots (4%) of the cell lysates were collected before the incubation with streptavidin-agarose and were analyzed directly by immunoblotting to determine the total amount of TRPC6 in the samples (bottom). B, the immunoblots from A were scanned, and the TRPC6 bands were quantified using ImageJ software. The biotinylated-TRPC6/total TRPC6 ratios were graphed relative to the ratio of the negative control (siCTL). C, the immunoblots from A were scanned, and the TRPC6 and actin bands were quantified using ImageJ software. The total TRPC6/total actin ratios were graphed relative to the ratio of the negative control (siCTL). Results are expressed as the means ± S.D. of three independent experiments. *, p < 0.05.

Similar articles

Cited by

References

    1. Berridge M. J., Bootman M. D., Lipp P. (1998) Calcium. A life and death signal. Nature 395, 645–648 - PubMed
    1. Berridge M. J., Lipp P., Bootman M. D. (2000) The versatility and universality of calcium signaling. Nat. Rev. Mol. Cell Biol. 1, 11–21 - PubMed
    1. Pedersen S. F., Owsianik G., Nilius B. (2005) TRP channels. An overview. Cell Calcium 38, 233–252 - PubMed
    1. Vazquez G., Wedel B. J., Aziz O., Trebak M., Putney J. W., Jr. (2004) The mammalian TRPC cation channels. Biochim. Biophys. Acta 1742, 21–36 - PubMed
    1. Winn M. P., Conlon P. J., Lynn K. L., Farrington M. K., Creazzo T., Hawkins A. F., Daskalakis N., Kwan S. Y., Ebersviller S., Burchette J. L., Pericak-Vance M. A., Howell D. N., Vance J. M., Rosenberg P. B. (2005) A mutation in the TRPC6 cation channel causes familial focal segmental glomerulosclerosis. Science 308, 1801–1804 - PubMed

Publication types

MeSH terms