. 2012 Aug;138(2):251-69.
doi: 10.1007/s00418-012-0947-y. Epub 2012 Apr 6.

Cholesteatoma-associated fibroblasts modulate epithelial growth and differentiation through KGF/FGF7 secretion

Affiliations

Cholesteatoma-associated fibroblasts modulate epithelial growth and differentiation through KGF/FGF7 secretion

Salvatore Raffa et al. Histochem Cell Biol. 2012 Aug.

Abstract

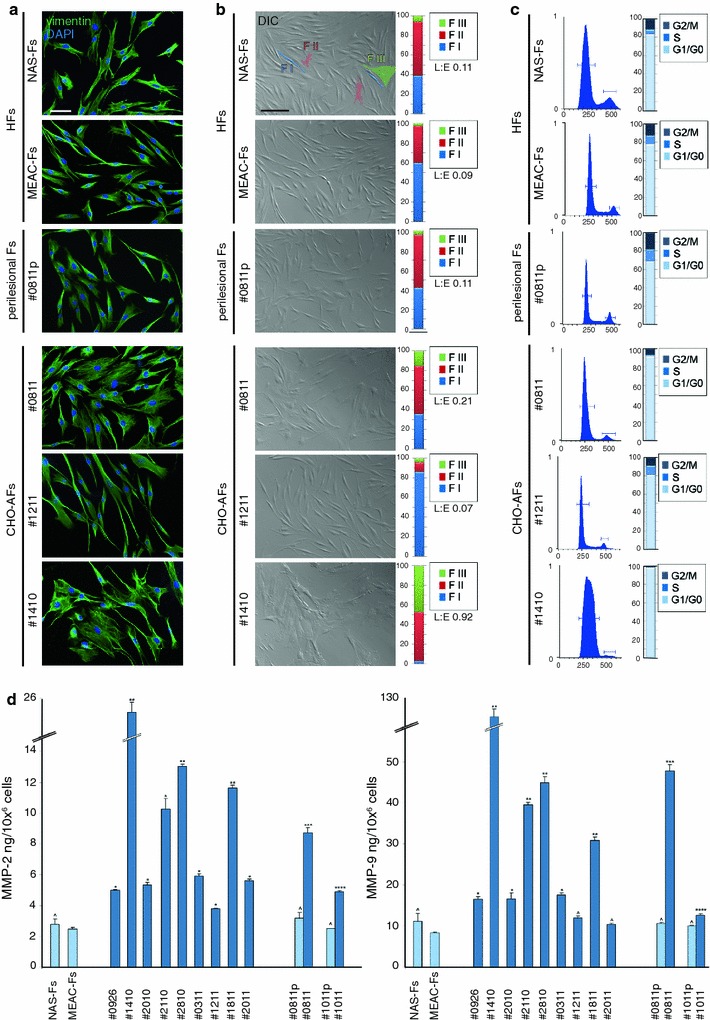
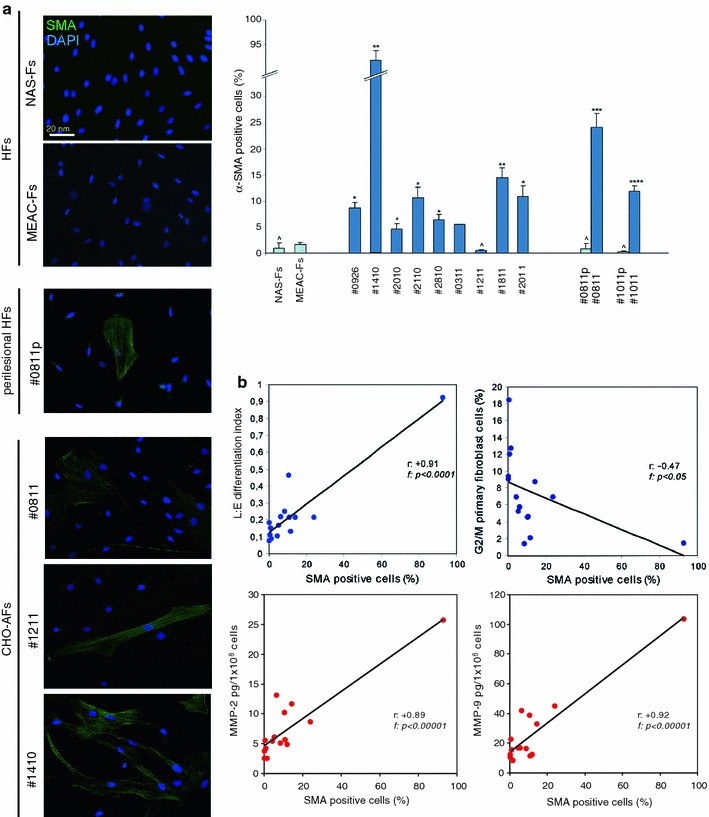
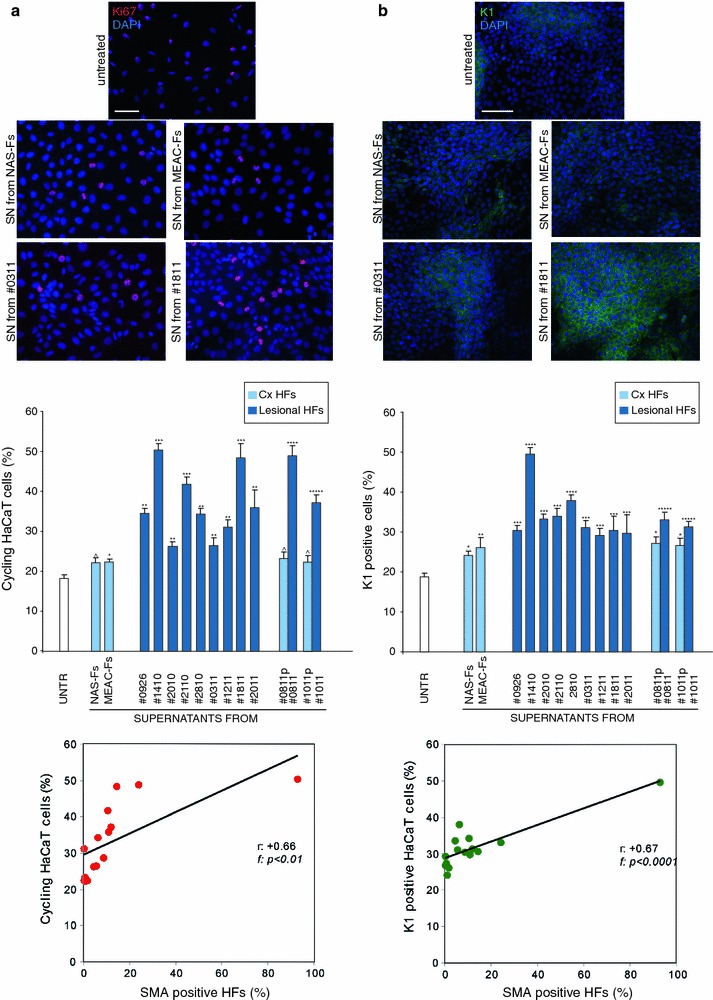
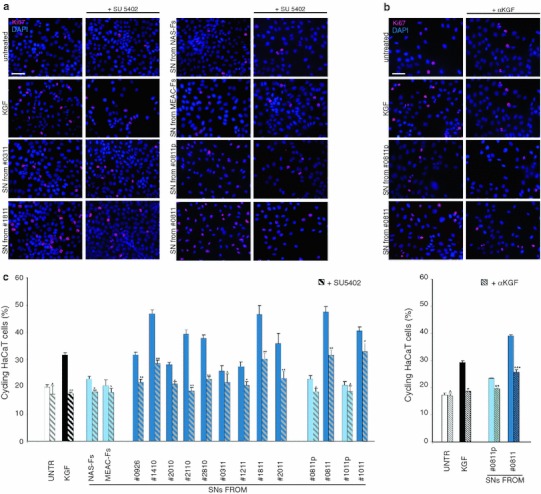
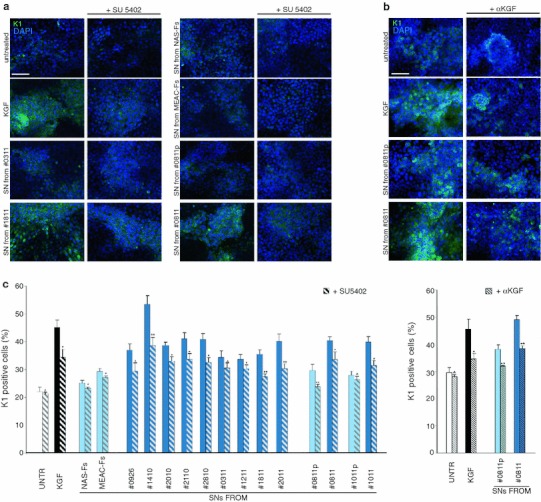
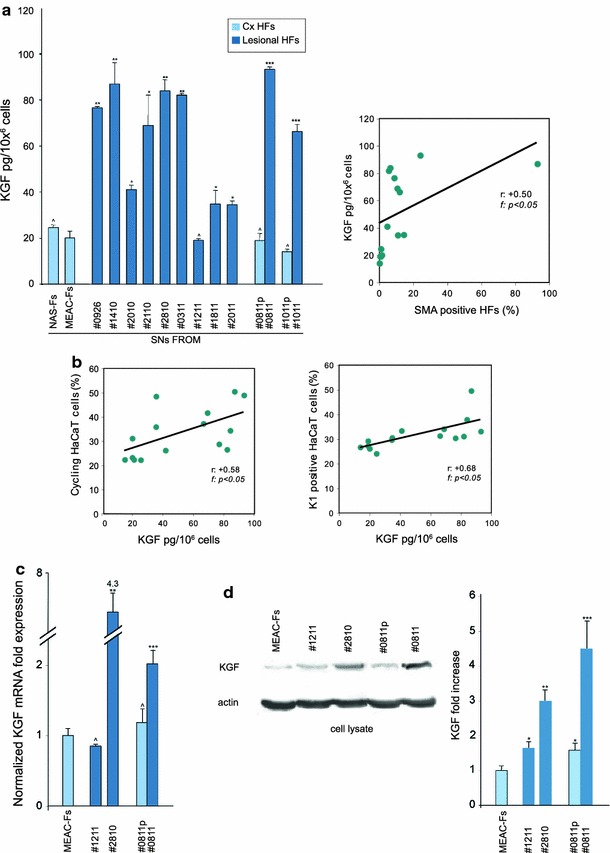
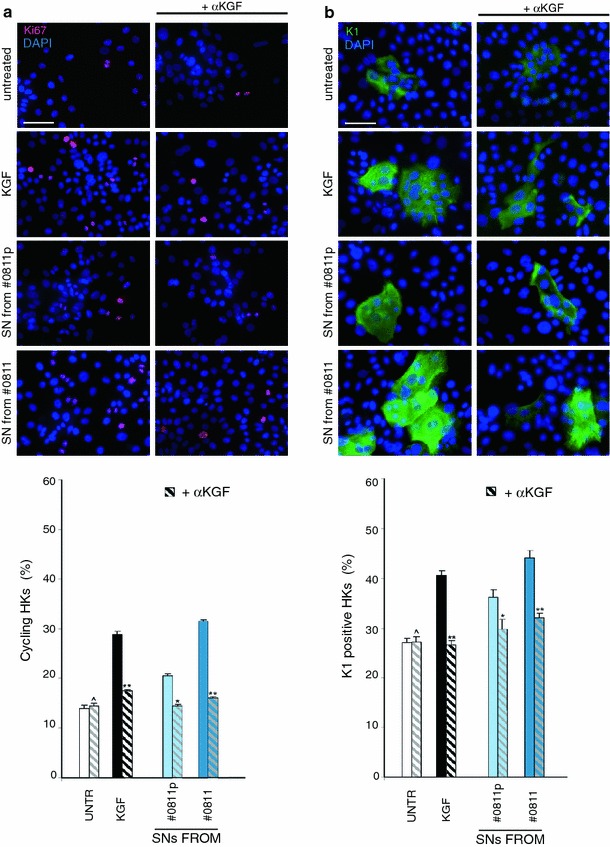
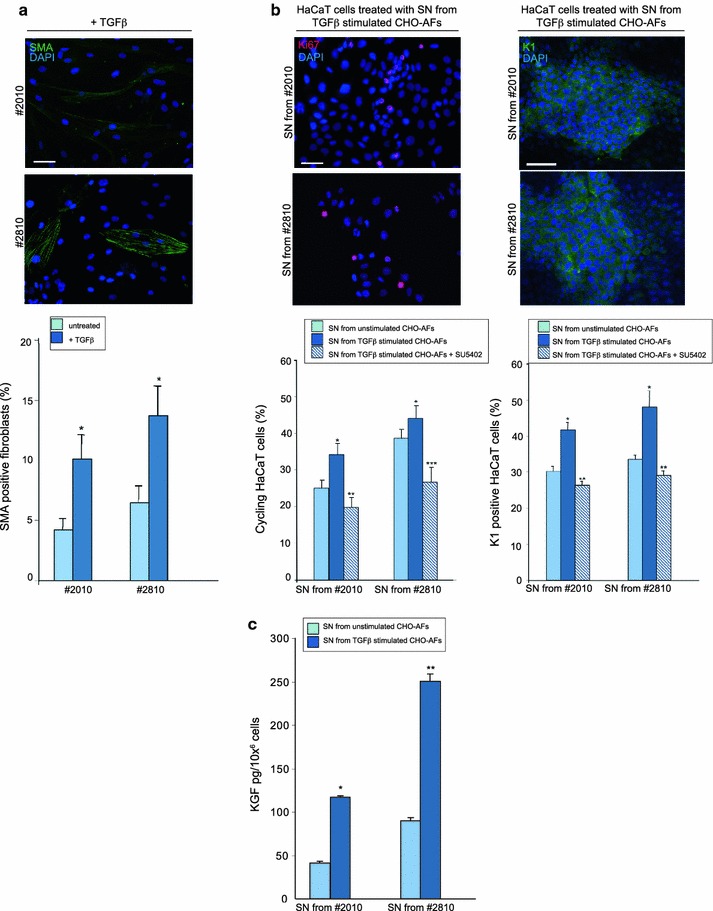
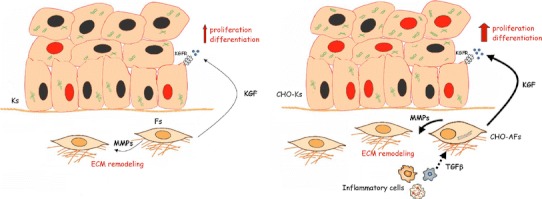
The keratinocyte growth factor (KGF/FGF7), produced by stromal cells, is a key paracrine mediator of epithelial proliferation, differentiation and migration. Expression of the growth factor is increased in wound healing and in hyperproliferative epithelial diseases, as a consequence of the activation of dermal fibroblasts by the inflammatory microenvironment. The middle ear cholesteatoma, an aural epidermal pathology characterized by keratinocyte hyperproliferation and chronic inflammation, may represent a model condition to study the epithelial-mesenchymal interactions. To develop an in vitro model for this disease, we isolated and characterized human primary cultures of fibroblasts associated with the cholesteatoma lesion, analyzing their secretory behaviour and degree of differentiation or activation. Compared to the perilesional or control normal fibroblasts, all cultures derived from cholesteatoma tissues were less proliferating and more differentiated and their highly variable activated phenotype correlated with the secretion of KGF as well as of metalloproteases 2 and 9. Culture supernatants collected from the cholesteatoma-associated fibroblasts were able to increase the proliferation and differentiation of human keratinocytes assessed by the expression of Ki67 and keratin-1 markers. The single crucial contribution of the KGF released by fibroblasts on the keratinocyte biological response was shown by the specific, although partial, block induced by inhibiting the KGF receptor or by immunoneutralizing the growth factor. Altogether, these results suggest that the activation of the stromal fibroblasts present in the pathological tissue, and the consequent increased secretion of KGF, play a crucial role in the deregulation of the epidermal proliferation and differentiation.


Figures

Fig. 1
Fig. 1
Characterization of the primary cultures of cholesteatoma-associated fibroblasts. a Immunofluorescence analysis of expression of the mesenchymal marker vimentin on representative example of different cultures of human fibroblasts isolated from non-auricolar skin (NAS-Fs), from normal skin of the medial external auditory canal (MEAC-Fs), from middle ear cholesteatoma samples (CHO-AFs) and from perilesional tissue of cholesteatomatous patients (perilesional-Fs). in all cultures, the cells are positive for vimentin staining, which appears as perinuclear cytoplasmic bundles of filaments. Nuclei are stained with DAPI. Bar 20 μm. b Morphologycal analysis of the primary cultures by differential interference contrast microscopy. Three differentiation stages were defined: FI, small spindle shaped cell (blue); FII: small epithelioid cells (red); FIII: large epithelioid cells (green). The Late:Early (L:E) ratio was calculated. The quantitative analysis indicate that among the CHO-AFs the percentages of cells in the more differentiated stages FII, FIII and the L:E ratio are highly variable. In contrast, in the control perilesional-Fs and in MEAC-Fs or NAS-Fs the percentages are homogenous. Bar 50 μm. c Fibroblast cultures were stained with PI and analyzed for cell cycle distribution with flow cytometry. The percentage of cells in G2/M results lower in CHO-AFs compared to control cultures and the more quiescent phenotype frequently corresponds to a higher L:E ratio. d MMP-2 and -9 quantitation by ELISA test on cellular homogenates from CHO-AFs, perilesional-Fs, MEAC-Fs, NAS-Fs. The MMP-2 and -9 levels in CHO-AFs were detected in various amounts but are higher respect to the cellular homogenates from control fibroblasts. Results reported in graph represent the mean values ± SE. Mann–Withney test was performed and significance level has been defined as described in “Materials and methods”. Statistics for MMP-2: ^p = NS versus MEAC-Fs and p = NS versus MEAC-Fs; *p < 0.05 versus MEAC-Fs; **p < 0.01 versus MEAC-Fs; ***p < 0.01 versus MEAC-Fs and p < 0.01 versus corresponding perilesional-Fs, ****p < 0.05 versus MEAC-s and p < 0.05 versus corresponding perilesional-Fs. Statistics for MMP-9: ^p = NS versus MEAC-Fs; *p < 0.05 versus MEAC-Fs; **p < 0.01 versus MEAC-Fs; ***p < 0.001 versus MEAC-Fs and p < 0.001 versus corresponding perilesional-Fs, ****p < 0.05 versus MEAC-s and p < 0.05 versus corresponding perilesional-Fs
Fig. 2
Fig. 2
Evaluation of α-SMA expression. a Immunofluorescence analysis of the expression of the activation and differentiation markers anti α-SMA shows a signal localized in intracellular filaments, also organized in bundles, situated in the peripheral areas of the cytoplasm and enhanced in most of CHO-AFs compared to control cells. The percentage of α-SMA positive cells is higher in most CHO-AFs cultures respect to perilesional-Fs and control cells. Nuclei are stained with DAPI. Bar 20 μm. Student’s t test was performed and significance level has been defined as described in “Materials and methods”. Results reported in graph represent the mean values ± SE. Statistics: ^p = NS versus MEAC-Fs and p = NS versus MEAC-Fs; *p < 0.05 versus MEAC-Fs; **p < 0.01 versus MEAC-Fs; ***p < 0.001 versus MEAC-Fs and p < 0.001 versus corresponding perilesional-Fs, ****p < 0.01 versus MEAC-s and p < 0.01 versus corresponding perilesional-Fs. b Correlation by linear regression analysis between α-SMA positivity rates and differentiation parameters. The L:E ratio and the metalloproteinases-2 and -9 levels, show a strong positive correlation with α-SMA expression in the primary fibroblast cultures (r: +0.91, f: p < 0.0001; r: +0.89, f: p < 0.00001; r: +0.92, f: p < 0.00001); in contrast the fraction of cells in G2/M shows a negative correlation with α-SMA expression (r: −0.47, f: p < 0.05)
Fig. 3
Fig. 3
Biological effects induced by SNs from the fibroblast cultures on keratinocyte proliferation and differentiation. a HaCaT cells were serum-starved, treated with SNs of different primary cultures of fibroblasts for 48 h at 37 °C, fixed and immunostained with anti-Ki67 polyclonal antibodies, which identifies cycling cells. Quantitative immunofluorescence analysis indicates that the percentage of cells presenting positive nuclei was higher in HaCaT treated with SNs collected from CHO-AFs respect to that treated with SNs from control cells. The SNs from perilesional-Fs (#0811p and #1011p) induce a lower proliferating rate respect to SNs from the corresponding lesional tissue (#0811and #1011), but similar to SNs of control fibroblasts NAS-Fs and MEAC-Fs. At linear regression analysis, the proliferation rate induced by the different fibroblast derived SNs on HaCaT cells shows a positive correlation with α-SMA expression in the corresponding primary fibroblast cultures (r: +0.66; f: p < 0.01). Results reported in graph represent the mean values ± SE. Nuclei are stained with DAPI. Bar 20 μm. Student’s t test was performed and significance level has been defined as described in “Materials and methods”. Statistics: ^p < 0.05 versus untreated and p = NS versus MEAC-Fs; *p < 0.05 versus untreated; **p < 0.05 versus MEAC-Fs; ***p < 0.01 versus MEAC-Fs, ****p < 0.01 versus MEAC-Fs and p < 0.01 versus corresponding perilesional-Fs; *****p < 0.01 versus MEAC-Fs and p < 0.05 versus corresponding perilesional-Fs. b Confluent HaCaT cells were serum-starved, treated with SN as above, fixed and immunostained with anti-K1 polyclonal antibodies, which identify early differentiated cells. Quantitative immunofluorescence analysis reveals that SNs collected from CHO-AFs induce a higher differentiation respect to SNs from control cells. Cells treated with SNs from perilesional-Fs (#0811p and #1011p) appear less differentiated respect to those treated with SNs from the corresponding lesional tissue (#0811and #1011) and similar to SNs of NAS-Fs and MEAC-Fs. At the linear regression analysis, the percentage of K1 positive keratinocytes in response to the different SNs shows a positive correlation with α-SMA expression of the corresponding fibroblast (r: +0.67; f: p < 0.0001). Nuclei are stained with DAPI. Bar 50 μm. Results reported in graph represent the mean values ± SE. Student’s t test was performed and significance level has been defined as described in “Materials and methods”. Statistics: *p < 0.05 versus untreated and p = NS versus MEAC-Fs; **p < 0.05 versus untreated; ***p < 0.05 versus untreated and p = NS versus MEAC-Fs, ****p < 0.01 versus untreated and p < 0.01 versus MEAC-Fs; *****p < 0.05 versus MEAC-Fs and p < 0.05 versus corresponding perilesional-Fs
Fig. 4
Fig. 4
Reduction of the SN proliferation effects by inhibition of the KGFR activity or block of the KGF binding to the receptor. HaCaT cells were serum-starved, treated with SNs or with KGF for 48 h at 37 °C in presence of the specific FGFR tyrosine kinase inhibitor SU5402 (a) or of the neutralizing anti-KGF antibodies (b), fixed and immunostained with anti-Ki67 polyclonal antibodies. Quantitative immunofluorescence analysis indicates that inhibition of the KGFR activity as well as block of the KGF binding to the receptor induce a reduction in the percentage of cycling cells in response to the different SNs. The reduction is more evident after treatment with SNs from CHO-AFs, as well as after KGF treatment, respect to SNs from control cells. Nuclei are stained with DAPI. Bar 20 μm. c Results reported in graph represent the mean values ± SE. Student’s t test was performed and significance level has been defined as described in “Materials and methods”: Statistics: (left): ^p = NS versus corresponding untreated; *p < 0.05 versus corresponding untreated; **p < 0.01 versus corresponding untreated; (right): ^ p = NS versus corresponding untreated; *p < 0.01 versus corresponding untreated; **p < 0.05 versus corresponding untreated; ***p < 0.01 versus corresponding untreated
Fig. 5
Fig. 5
Reduction of the SN differentiation effects by inhibition of the KGFR activity or block of the KGF binding to the receptor. Confluent HaCaT cells were serum-starved, treated with SN or with KGF in presence of SU5402 (a) or anti-KGF antibodies (b) as above, fixed and immunostained with anti-K1 polyclonal antibodies. Quantitative immunofluorescence analysis shows that inhibition of KGFR activity as well as block of the KGF binding to the receptor reduce the differentiation marker expression induced by the different SNs. The reduction is more evident in HaCaT cells treated with SNs from CHO-AFs and is similar to that observed for KGF treatment. Nuclei are stained with DAPI. Bar 50 μm. c Results reported in graph represent the mean values ± SE. Student’s t test was performed and significance level has been defined as described in “Materials and method”. Statistics: (left): ^p = NS versus corresponding untreated cells; *p < 0.05 versus corresponding untreated cells; **p < 0.01 versus corresponding untreated cells; (right): ^ p = NS versus corresponding untreated cells; *p < 0.05 versus corresponding untreated cells; **p < 0.01 versus corresponding untreated cells
Fig. 6
Fig. 6
KGF expression and secretion in the culture SNs. a KGF-quantitation by ELISA test on SNs from the different cultures of fibroblasts. The KGF levels released in the CHO-AFs medium are variable but higher than in the SNs from control cells. The KGF amounts in different SNs show a positive correlation with α-SMA expression in the corresponding primary fibroblast cultures (r: +0.50; f: p < 0.05). Results reported in graph represent the mean values ± SE. Mann–Withney test was performed and significance level has been defined as described in “Materials and methods”. Statistics: ^p = NS versus MEAC-Fs; *p < 0.05 versus MEAC-Fs; **p < 0.01 versus MEAC-Fs; ***p < 0.01 versus MEAC-Fs and p < 0.01 versus corresponding perilesional-Fs. b In HaCaT cells treated with the different SNs, the proliferation rate and the percentage of K1 positive cells show a positive correlation with KGF levels released in the SNs (r: +0.58 and +0.68, respectively; p < 0.05). c KGF mRNA transcript levels were quantitated by real-time PCR: a clear fold increase in KGF mRNA expression is observed in lesional SNs compared to MEAC-Fs and perilesional-Fs. d Western blot analysis on the cell lysates shows that the specific band corresponding to KGF protein is increased in lesional Fs. The equal loading was assessed with anti-actin antibody. Statistics for the densitometric analysis: *p < 0.05 versus MEAC-Fs; **p < 0.01 versus MEAC-Fs; ***p < 0.01 versus MEAC-Fs and #0811p
Fig. 7
Fig. 7
Proliferative and differentiative effects induced by SNs from the fibroblast cultures on primary cultured human keratinocytes. HKs were serum-starved, treated with SNs for 48 h at 37 °C, fixed and immunostained with anti-Ki67 (a) or with anti-K1 polyclonal antibodies (b), also in the in presence of netralizing anti-KGF antibodies as above. Quantitative immunofluorescence analysis (c) indicates that the percentage of Ki67-positive or K1-positive cells was higher in HKs treated with SNs collected from CHO-AFs in respect to that treated with SNs from control cells and that the block of the KGF binding to the receptor by addition of anti-KGF antibodies reduces the effects of SNs. Nuclei are stained with DAPI. Bar 20 μm. Statistics: (left): ^p = NS versus corresponding untreated cells; *p < 0.05 versus corresponding untreated cells; **p < 0.01 versus corresponding untreated cells; (right): ^p = NS versus corresponding untreated cells; *p < 0.05 versus corresponding untreated cells; **p < 0.01 versus corresponding untreated cells
Fig. 8
Fig. 8
Evaluation of biological effects induced on HaCaT cells by SNs from CHO-AFs stimulated with TGFβ. a Two selected cultures of CHO-AFs, #2010 and #2810, were treated with TGFβ for 48 h at 37 °C and then fixed and stained with anti-α-SMA. Quantitative immunofluorescence analysis of the percentage of α-SMA positive cells shows that, respect to untreated cells, TGFβ treatment induces an increase of the α-SMA positive cells in both cultures. Nuclei are stained with DAPI Bar 20 μm. Results reported in graph represent the mean values ± SE. Student’s t test was performed and significance level has been defined as described in “Materials and methods”: Statistics: *p < 0.05 versus untreated. b HaCaT cells were serum-starved, treated for 48 h at 37 °C with the SN from #2010 and #2810 cultures treated with TGFβ as above. The treatments were performed also in the presence of the KGFR inhibitor SU5402. The cells were then fixed and immunostained with anti-Ki67 or with anti-K1 polyclonal antibodies. Quantitative immunofluorescence analysis of the Ki67 or K1 positive cells shows that the SNs from cultures treated with TGFβ induce an enhance the proliferation and differentiation of HaCaT cells respect to the SNs from untreated cultures. Inhibition of the KGFR activity reduces the effects of SNs. Nuclei are stained with DAPI. Bars 20 μm (left panel) and 50 μm (right panel). Results reported in graph represent the mean values ± SE. Student’s t test was performed and significance level has been defined as described in materials and methods. Statistics for proliferation analysis: *p < 0.05 versus SNs from unstimulated CHO-AFs, **p < 0.05 versus SNs from unstimulated #2010 and p < 0.01 versus SNs from TGFβ stimulated #2010, ***p < 0.05 versus SNs from unstimulated and TGFβ stimulated #2810. Statistics for differentiation analysis: * p < 0.01 versus SNs from unstimulated CHO-AFs, **p < 0.05 versus SNs from unstimulated CHO-AFs and p < 0.01 versus SNs from TGFb stimulated CHO-AFs. c KGF-quantitation by ELISA test on SNs from #2010 and #2810 cultures treated with TGFβ as above. In both cultures the amount of KGF released in the medium is higher in SNs from TGFβ treated cells respect to the SNs from untreated cells. Results reported in graph represent the mean values ± SE. Mann–Withney test was performed and significance level has been defined as described in “Materials and methods”. Statistics: *p < 0.05 and **p < 0.01 versus untreated
Fig. 9
Fig. 9
Schematic drawing of the proposed role of the cholesteatoma-associated fibroblasts (CHO-AFs) in the deregulation of epidermal proliferation and differentiation through a paracrine loop involving secretion of KGF: in the pathological framework (right panel), the CHO-AFs, activated by growth factors and cytokines (such as TGFβ) released by inflammatory cells, produce an increased amount of KGF compared to the physiological conditions (left panel). Through binding to its receptor KGFR, the growth factor increases keratinocyte proliferation and differentiation. The activated CHO-AFs release in the stroma also enhanced levels of MMPs which contribute in the remodeling and degradation of the extracellular matrix

Similar articles

Cited by

References

    1. Albers-op t’ Hof BM, Peek FA, Huisman MA, Grote JJ. Air-exposed tissue culture of human middle ear epithelium and meatal epidermis: a method to study the advancing front of cholesteatoma. Acta Otolaryngol. 2002;122:720–725. doi: 10.1080/00016480260349782. - DOI - PubMed
    1. Barbara M, Raffa S, Murè C, et al. Keratinocyte growth factor receptor (KGF-R) in cholesteatoma tissue. Acta Otolaryngol. 2008;128:360–364. doi: 10.1080/00016480701785004. - DOI - PubMed
    1. Bayreuther K, Rodemann HP, Hommel R, Dittmann K, Albiez M, Francz PI. Human skin fibroblasts in vitro differentiate along a terminal cell lineage. Proc Natl Acad Sci USA. 1988;14:5112–5116. doi: 10.1073/pnas.85.14.5112. - DOI - PMC - PubMed
    1. Belleudi F, Leone L, Nobili V, Raffa S, Francescangeli F, et al. Keratinocyte growth factor receptor ligands target the receptor to different intracellular pathways. Traffic. 2007;8:1854–1872. doi: 10.1111/j.1600-0854.2007.00651.x. - DOI - PubMed
    1. Belleudi F, Purpura V, Torrisi MR. The receptor tyrosine kinase FGFR2b/KGFR controls early differentiation of human keratinocytes. PLoS ONE. 2011;6:e24194. doi: 10.1371/journal.pone.0024194. - DOI - PMC - PubMed

Publication types

LinkOut - more resources