. 2012 Apr 1;13(5):499-510.
doi: 10.1038/ni.2262.

Transcriptional profiling of stroma from inflamed and resting lymph nodes defines immunological hallmarks

Collaborators, Affiliations

Transcriptional profiling of stroma from inflamed and resting lymph nodes defines immunological hallmarks

Deepali Malhotra et al. Nat Immunol. .

Abstract

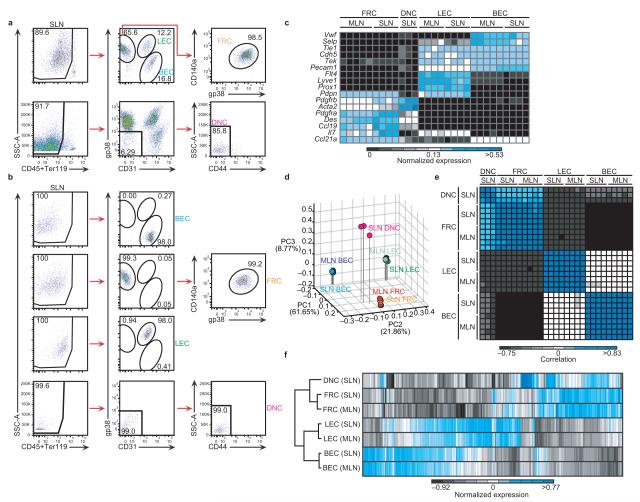
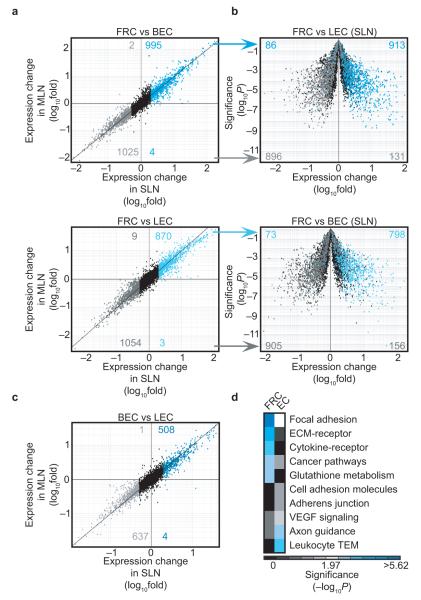
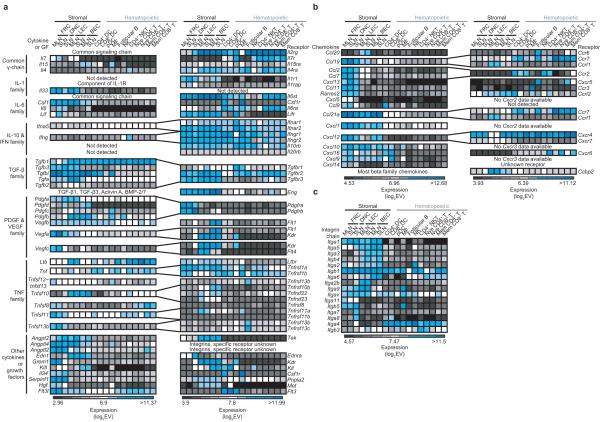
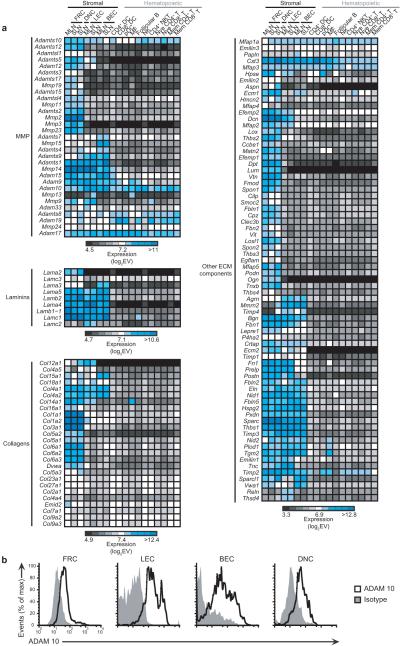
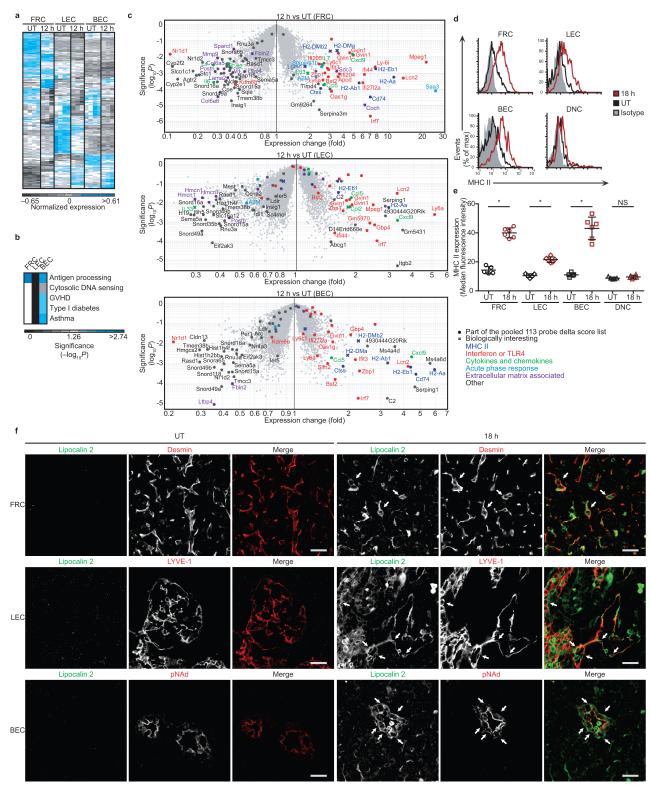
Lymph node stromal cells (LNSCs) closely regulate immunity and self-tolerance, yet key aspects of their biology remain poorly elucidated. Here, comparative transcriptomic analyses of mouse LNSC subsets demonstrated the expression of important immune mediators, growth factors and previously unknown structural components. Pairwise analyses of ligands and cognate receptors across hematopoietic and stromal subsets suggested a complex web of crosstalk. Fibroblastic reticular cells (FRCs) showed enrichment for higher expression of genes relevant to cytokine signaling, relative to their expression in skin and thymic fibroblasts. LNSCs from inflamed lymph nodes upregulated expression of genes encoding chemokines and molecules involved in the acute-phase response and the antigen-processing and antigen-presentation machinery. Poorly studied podoplanin (gp38)-negative CD31(-) LNSCs showed similarities to FRCs but lacked expression of interleukin 7 (IL-7) and were identified as myofibroblastic pericytes that expressed integrin α(7). Together our data comprehensively describe the transcriptional characteristics of LNSC subsets.


Figures

Figure 1
Figure 1
Lymph node stromal cell sorting strategy and validation. (a) Sorting strategy used to isolate FRCs, LECs, BECs, and DNCs from stromal-cell enriched fractions of pooled SLNs or MLNs. Percentages of CD45 stroma (left) and each LNSC subset (center and right) are shown. Data represent 3-5 experiments. (b) A representative post sort purity analysis of SLN FRCs, LECs, BECs, and DNCs. Data shown are representative of 3-5 independent replicates. (c) Heatmap depicting expression of genes characteristic of FRCs, LECs, or BECs. Microarray expression values were row-normalized using the “Hierarchical Clustering” module (GenePattern). (d) Principal component analysis of LNSC subsets calculated on the 15% most differentially expressed probes (EV>120 for any subset) among LNSC subsets. Percentages reflect the proportion of total variability explained by each principal component. Expression values were log2 transformed and standardized across rows and columns prior to computing principal components. (e) Heatmap representation of coefficients of correlation computed using the 15% most differentially expressed probes among LNSCs. Most highly correlated samples are shown in blue. Expression value data was log2 transformed and row-standardized. (f) Unbiased hierarchical clustering of differentially expressed probes (EV>120 for any population, FC>2 in any pair-wise population comparison, and CV<0.5 within each population). Population expression values (EV) were log2 transformed, row mean-centered, and row-normalized using the “Hierarchical Clustering” module (GenePattern) before clustering. Population means were computed from 3-5 independent replicates.
Figure 2
Figure 2
Unbiased analysis of lymph node stromal cells provides insight into FRC function. (a) Fold change (FC)-FC comparisons of FRC expression profiles with BEC (top) or LEC (bottom) profiles. SLN and MLN data are displayed. Probes falling along the diagonal show similar expression in both sites. Probes upregulated (FC>2, EV>120 for at least one LNSC subset, and CV<0.5 for all LNSCs) in SLN FRCs are blue. Probes upregulated by SLN BECs (top) or SLN LECs (bottom) are gray. Numbers of probes in each quadrant are labeled. Data consist of 4-5 independent replicates. (b) Probes identified in (a) were projected onto volcano plots (fold change versus P value) of SLN FRCs and the other SLN endothelial subset (top: LECs, bottom: BECs). Numbers denote total highlighted probes on that side of the y-axis. Data consist of 4-5 independent replicates. (c) FC-FC analysis of BEC and LEC expression profiles. Upregulated probes (FC>2, EV>120 for at least one LNSC subset, and CV<0.5 for all LNSCs) in BECs (blue) or LECs (gray) are highlighted. Data consist of 4-5 independent replicates. (d) Enrichment in KEGG pathways for probes upregulated (δ=1.0 (adjusted FC≥2) for at least one comparison and δ=0.85 (adjusted FC≥1.8) for all other comparisons; P<0.05 for differences in expression) in FRCs relative to ECs or vice versa. Most significantly enriched (Benjamini P value) pathways (mmu04510:focal adhesion, mmu04512:ECM-receptor interaction, mmu04060:cytokine-cytokine receptor interaction, mmu05200:pathways in cancer, mmu00480:glutathione metabolism, mmu04514:cell adhesion molecules, mmu04520:adherens junction, mmu04370:VEGF signaling pathway, mmu04360:axon guidance, and mmu04670:leukocyte transendothelial migration) are shown in blue.
Figure 3
Figure 3
Expression of cytokines, growth factors, and immunologically relevant receptors by stromal and hematopoietic cell subsets. (a) Heatmap analysis of cytokine, growth factor, and receptor expression (EV>120 for the receptor or ligand in any stromal population) among LNSCs and 11 LN hematopoietic subsets. Data was log2 transformed. Data represent 3-5 independent replicates. (b) Chemokine and chemokine receptor analysis as in (a). (c) Integrin expression analysis as in (a).
Figure 4
Figure 4
Transcriptional insights into the lymph node conduit network. (a) Proteinaceous ECM components were identified by gene ontology (AmiGO). Representative heatmaps of expressed probes (EV>120 for any LNSC population) are shown. Data has been log2 transformed; more highly expressed probes are shown in blue. Data represent 3-5 independent replicates. (b) Flow cytometric analysis of ADAM 10 (unshaded, black) expression by freshly isolated SLN FRCs, LECs, BECs, and DNCs relative to an isotype control (shaded, gray). Data represent n=7 mice from 3 independent experiments. (c) High magnification confocal immunofluorescent images of T-zone reticular fibers costained for the ER-TR7 antigen (red) and novel collagen core components (green): collagen XIV (top left), decorin (top right), biglycan (bottom left), and fibromodulin (bottom right). (d) Costaining of ER-TR7 (red) and the novel microfibrillar zone constituent, collagen VI (green) as in (c). (e) Costaining of ER-TR7 (red) and the newly localized basement membrane component: vitronectin (green) as in (c). Scale bars are 2 μm for all images. Data represent 4-5 independent experiments.
Figure 4
Figure 4
Transcriptional insights into the lymph node conduit network. (a) Proteinaceous ECM components were identified by gene ontology (AmiGO). Representative heatmaps of expressed probes (EV>120 for any LNSC population) are shown. Data has been log2 transformed; more highly expressed probes are shown in blue. Data represent 3-5 independent replicates. (b) Flow cytometric analysis of ADAM 10 (unshaded, black) expression by freshly isolated SLN FRCs, LECs, BECs, and DNCs relative to an isotype control (shaded, gray). Data represent n=7 mice from 3 independent experiments. (c) High magnification confocal immunofluorescent images of T-zone reticular fibers costained for the ER-TR7 antigen (red) and novel collagen core components (green): collagen XIV (top left), decorin (top right), biglycan (bottom left), and fibromodulin (bottom right). (d) Costaining of ER-TR7 (red) and the novel microfibrillar zone constituent, collagen VI (green) as in (c). (e) Costaining of ER-TR7 (red) and the newly localized basement membrane component: vitronectin (green) as in (c). Scale bars are 2 μm for all images. Data represent 4-5 independent experiments.
Figure 5
Figure 5
Transcriptional specialization of fibroblastic reticular cells, thymic fibroblasts, and skin fibroblasts. (a) Principal component analysis of the 15% most differentially expressed probes among SLN FRCs, MLN FRCs, skin fibroblasts (SFs), and thymic fibroblasts (ThFs). Expression values were log2 transformed and standardized across rows and columns before calculating principal components. (b) Heatmap of Pearson coefficient of correlation values computed using the 15% most differentially expressed probes identified in (a). Samples with highest correlation are shown in blue. Expression data was log2 transformed and row-standardized prior to analysis. (c) Heatmap of Euclidean distances calculated on the 15% most differentially expressed probes identified in (a). Data was transformed as in (b). Samples with the smallest distance are shown in blue. (d) Significant (Benjamini P<0.05) hits from pooled KEGG pathway enrichment analyses of cell type-specific lists generated from pairwise “Delta Score” and “Multiplot” analyses (GenePattern, δ=1 (adjusted FC≥2), P<0.05) were plotted on scatter plots. Benjamini P values are shown in terms of FRC enrichment (left), SF enrichment (middle), or ThF enrichment (right). 5 biologically interesting hits (mmu04612:antigen processing and presentation, mmu04060:cytokine-cytokine receptor interaction, mmu04270:vascular smooth muscle contraction, mmu04512:ECM-receptor interaction, and mmu04510:focal adhesion) are shown in color. (e) Contractile activity of FRCs, NIH3T3 fibroblasts, and C2C12 myoblasts was compared in vitro. Data are representative of 2 experiments. Data are shown as mean±SD. *P < 0.05.
Figure 6
Figure 6
Cadherin-11 identifies junctions between lymph node fibroblastic reticular cells. (a) Stromal and hematopoietic cell expression value data for candidate cell adhesion molecules. Expression values were log2 transformed. Data represent 3-5 independent replicates. (b) Flow cytometric analysis of cadherin-11 expression (unshaded, black) compared to a relevant isotype control (shaded, gray) in freshly isolated FRCs, LECs, BECs, DNCs, and bulk hematopoietic cells. Data represent 4 independent experiments. (c) Surface expression of cadherin-11 on in vitro expanded FRCs as in (b). Data represent 4 independent experiments. (d) Confocal immunofluorescence analysis of cadherin-11 (green) localization on in vitro expanded FRCs (f-actin, red; DAPI, blue). Scale bar is 10 μm. Images are representative of 4 independent experiments.
Figure 7
Figure 7
DNCs are contractile pericytes. (a) 2-class-EV versus FC plot of SLN DNCs and FRCs. Upregulated probes (EV>120 for any LNSC subset, FC>2, CV<0.5) are highlighted in blue (DNCs) or gray (FRCs). Numbers of upregulated probes are indicated. Data represent 3-4 independent replicates. Analysis of SLN DNCs and LECs (b) or BECs (c) as in (a). Data represent 3-4 independent replicates. (d) KEGG pathway enrichment by probes upregulated (δ=1 (adjusted FC≥2), P<0.05) in SLN DNCs relative to SLN FRCs or vice versa. Most significantly enriched (Benjamini P value) pathways (mmu04810:regulation of actin cytoskeleton, mmu04270:vascular smooth muscle contraction, mmu04510:focal adhesion, mmu04260:cardiac muscle contraction, mmu05410:hypertrophic cardiomyopathy, mmu05414:dilated cardiomyopathy, and mmu04060:cytokine-cytokine receptor interaction) are shown in blue. (e) LNSC, SF, and ThF expression of 12 vascular smooth muscle-associated genes upregulated in DNCs relative to FRCs. Data represent 3-4 independent replicates. Data are shown as mean+SD. (f) Stromal and hematopoietic expression of candidate DNC markers: calponin-1 (Cnn1) and integrin α7 (Itga7). Data represent 3-4 independent replicates. Data are shown as mean+SD. (g) Brightfield microscopy (original magnification: 100x) showing sorted FRCs and DNCs grown in a 3D-matrigel for 5 days. Arrows indicate visible matrix contraction. Data represent 3 independent experiments. (h) Immunofluorescence microscopy showing expression of ITGA7, F-actin, and DAPI. Cells were confirmed as DN by excluding gp38 and CD31 staining. Scale bar is 15 μm. Data represent 3 independent experiments. (i) Immunofluorescence microscopy showing expression of CNN1, F-actin, and DAPI as in (h). Scale bar represents 15 μm. Data represent 3 independent experiments.
Figure 8
Figure 8
LNSC response to inflammation. (a) Unbiased hierarchical clustering of 373 probes differentially expressed between corresponding stromal subsets from 12 h and untreated mice (EV>120 for either population, FC>2, and CV<0.5 within each population). Population EVs were log2 transformed, row mean-centered, and row-normalized using the “Hierarchical Clustering” module (GenePattern). Population means computed from 3-5 independent replicates. (b) KEGG pathway enrichment by probes upregulated (δ=1.0 (adjusted FC≥2), P<0.05) in 12 h LNSCs. Most significantly enriched (Benjamini P) pathways (mmu04612:antigen processing and presentation, mmu04623:cytosolic DNA-sensing pathway, mmu05332:graft-versus-host disease, mmu04940:type I diabetes mellitus, and mmu05310:asthma) shown in blue. (c) Projection of the 113 probes identified in (b) onto volcano plots of FRCs, LECs, and BECs from 12 h and untreated mice. Probes were biologically categorized. Data consist of 3-5 independent replicates. (d) Flow cytometric analysis of surface MHC II expression by SLN LNSCs from untreated (unshaded, black) and 18 h (unshaded, red) mice relative to an isotype control (shaded, gray). Data represent n=5-6 mice per condition from 2 independent experiments. (e) Summary median fluorescence intensity data for LNSC surface MHC II expression as in (d). Symbols represent individual mice; mean±SD is shown. Data represent n=5-6 mice per condition from 2 independent experiments. (f) Confocal immunofluorescence microscopy of SLN sections costained for LCN2 (green) and desmin (red, FRCs), LYVE-1 (red, LECs), or pNAd (red, BECs) from untreated and 18 h mice. Scale bar is 25 μm. Data represent n=5-6 mice per condition from 2 independent experiments. Arrows highlight examples of LCN2-expressing stroma.

Similar articles

Cited by

References

    1. Heng TS, Painter MW. The Immunological Genome Project: networks of gene expression in immune cells. Nat Immunol. 2008;9:1091–1094. doi:10.1038/ni1008-1091. - PubMed
    1. Link A, et al. Fibroblastic reticular cells in lymph nodes regulate the homeostasis of naive T cells. Nat Immunol. 2007;8:1255–1265. doi:10.1038/ni1513. - PubMed
    1. Fletcher AL, Malhotra D, Turley SJ. Lymph node stroma broaden the peripheral tolerance paradigm. Trends Immunol. 2011;32:12–18. doi:10.1016/j.it.2010.11.002. - PMC - PubMed
    1. Lee JW, et al. Peripheral antigen display by lymph node stroma promotes T cell tolerance to intestinal self. Nat Immunol. 2007;8:181–190. doi:10.1038/ni1427. - PubMed
    1. Gardner JM, et al. Deletional tolerance mediated by extrathymic Aire-expressing cells. Science. 2008;321:843–847. doi:10.1126/science.1159407. - PMC - PubMed

Publication types

MeSH terms

Associated data