Programmed death-1+ T cells and regulatory T cells are enriched in tumor-involved lymph nodes and associated with aggressive features in papillary thyroid cancer
- PMID: 22466343
- PMCID: PMC3387418
- DOI: 10.1210/jc.2011-3428
Programmed death-1+ T cells and regulatory T cells are enriched in tumor-involved lymph nodes and associated with aggressive features in papillary thyroid cancer
Abstract
Context: Recurrent metastatic lymph node (LN) disease is common in patients with papillary thyroid cancer (PTC). Novel prognostic markers may be helpful in guiding a therapeutic approach. Our previous studies revealed that immune suppression is evident in PTC and associated with more severe disease.
Objective: To characterize the immune response to metastatic PTC, we assessed CD4(+) T cell polarization in LN. In addition, we investigated the role of programmed death-1 (PD-1) and T cell exhaustion.
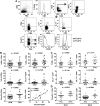
Design: Uninvolved (UILN) and tumor-involved lymph nodes (TILN) were sampled ex vivo by fine-needle biopsy. T cell subsets were identified by flow cytometry. In parallel, archived TILN specimens were characterized by immunofluorescence.
Setting: The study was conducted at the University of Colorado Hospital.
Patients: Data were collected on 94 LN from 19 patients with PTC undergoing neck dissection.
Main outcome: T cell subset frequencies were compared in UILN and TILN and assessed for correlation with recurrent disease and extranodal invasion.
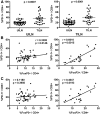
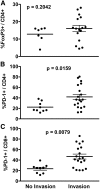
Results: Regulatory CD4(+) T cells (Treg) were enriched in TILN compared with UILN and further elevated in TILN from patients with recurrent disease. PD-1(+) T cells were present at high frequency in TILN and markedly enriched in TILN that showed evidence of extranodal invasion. In TILN, Treg frequency correlated with PD-1(+) T cell frequencies. Although PD-1(+) T cells produced interferon-γ, they failed to fully down-regulate CD27 and were not actively proliferating.
Conclusions: Increased Treg and PD-1(+) T cell frequencies in LN may be indicative of aggressive recurrent PTC. Future prospective studies are necessary to determine the prognostic and therapeutic value of these findings in PTC.
Figures


Similar articles
-
PD-1+Tim-3+ CD8+ T Lymphocytes Display Varied Degrees of Functional Exhaustion in Patients with Regionally Metastatic Differentiated Thyroid Cancer.Cancer Immunol Res. 2015 Jun;3(6):620-30. doi: 10.1158/2326-6066.CIR-14-0201. Epub 2015 Feb 19. Cancer Immunol Res. 2015. PMID: 25701326 Free PMC article.
-
Tumor-associated lymphocytes and increased FoxP3+ regulatory T cell frequency correlate with more aggressive papillary thyroid cancer.J Clin Endocrinol Metab. 2010 May;95(5):2325-33. doi: 10.1210/jc.2009-2564. Epub 2010 Mar 5. J Clin Endocrinol Metab. 2010. PMID: 20207826 Free PMC article.
-
Papillary thyroid cancer: controversies in the management of neck metastasis.Laryngoscope. 2008 Dec;118(12):2161-5. doi: 10.1097/MLG.0b013e31818550f6. Laryngoscope. 2008. PMID: 19029855
-
[Cervical lymph nodes metastases in patients with differentiated thyroid cancer].Arq Bras Endocrinol Metabol. 2007 Jul;51(5):813-7. doi: 10.1590/s0004-27302007000500019. Arq Bras Endocrinol Metabol. 2007. PMID: 17891245 Review. Portuguese.
-
The prognostic significance of nodal metastases from papillary thyroid carcinoma can be stratified based on the size and number of metastatic lymph nodes, as well as the presence of extranodal extension.Thyroid. 2012 Nov;22(11):1144-52. doi: 10.1089/thy.2012.0043. Epub 2012 Oct 19. Thyroid. 2012. PMID: 23083442 Review.
Cited by
-
The Thyroid Tumor Microenvironment: Potential Targets for Therapeutic Intervention and Prognostication.Horm Cancer. 2020 Oct;11(5-6):205-217. doi: 10.1007/s12672-020-00390-6. Epub 2020 Jun 17. Horm Cancer. 2020. PMID: 32548798 Free PMC article. Review.
-
Immune and Inflammatory Cells in Thyroid Cancer Microenvironment.Int J Mol Sci. 2019 Sep 7;20(18):4413. doi: 10.3390/ijms20184413. Int J Mol Sci. 2019. PMID: 31500315 Free PMC article. Review.
-
Association of PDCD1 gene markers with susceptibility to thyroid cancer.J Endocrinol Invest. 2017 May;40(5):481-486. doi: 10.1007/s40618-016-0579-5. Epub 2016 Dec 9. J Endocrinol Invest. 2017. PMID: 27943063
-
Programmed Death-Ligand 1 Expression and Its Correlation with Lymph Node Metastasis in Papillary Thyroid Carcinoma.J Pathol Transl Med. 2018 Jan;52(1):9-13. doi: 10.4132/jptm.2017.07.26. Epub 2017 Oct 3. J Pathol Transl Med. 2018. PMID: 28994272 Free PMC article.
-
Causal role of immune cells in thyroid cancer: a bidirectional Mendelian randomization study.Front Immunol. 2024 Jun 17;15:1425873. doi: 10.3389/fimmu.2024.1425873. eCollection 2024. Front Immunol. 2024. PMID: 38953025 Free PMC article.
References
-
- Davies L, Welch HG. 2006. Increasing incidence of thyroid cancer in the United States, 1973–2002. JAMA 295:2164–2167 - PubMed
-
- Mazzaferri EL, Jhiang SM. 1994. Long-term impact of initial surgical and medical therapy on papillary and follicular thyroid cancer. Am J Med 97:418–428 - PubMed
-
- National Cancer Institute 2007. Surveillance Epidemiology and End Results (SEER): cancer statistics review, 1973–2005. National Institutes of Health: www.cancer.gov
-
- Bates GJ, Fox SB, Han C, Leek RD, Garcia JF, Harris AL, Banham AH. 2006. Quantification of regulatory T cells enables the identification of high-risk breast cancer patients and those at risk of late relapse. J Clin Oncol 24:5373–5380 - PubMed
Publication types
MeSH terms
Substances
Grants and funding
LinkOut - more resources
Full Text Sources
Medical
Research Materials

