. 2012 Mar 28;32(13):4372-85.
doi: 10.1523/JNEUROSCI.5851-11.2012.

The lhx2 transcription factor controls thalamocortical axonal guidance by specific regulation of robo1 and robo2 receptors

Affiliations

The lhx2 transcription factor controls thalamocortical axonal guidance by specific regulation of robo1 and robo2 receptors

Paula Marcos-Mondéjar et al. J Neurosci. .

Abstract

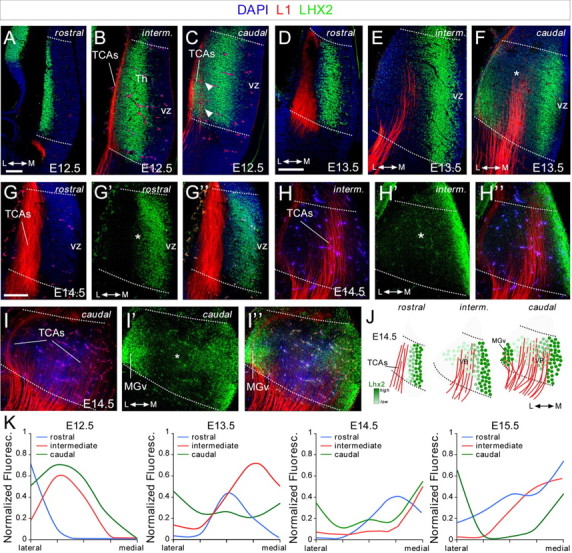
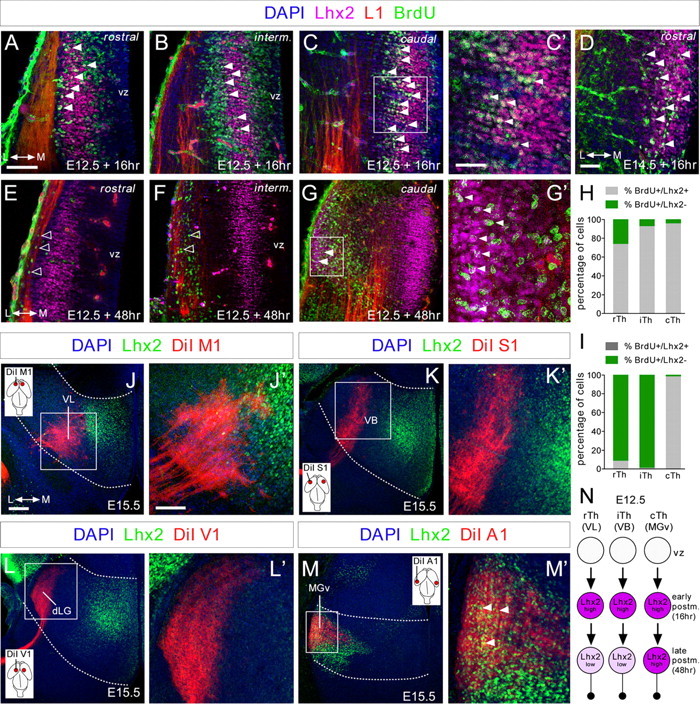
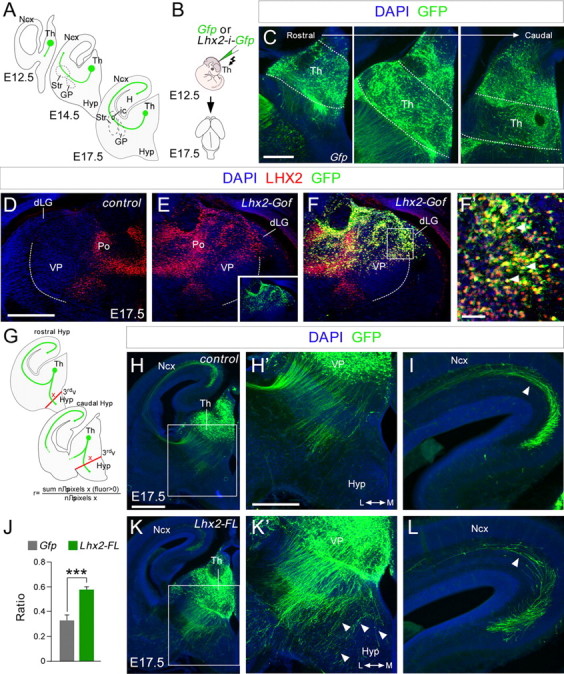
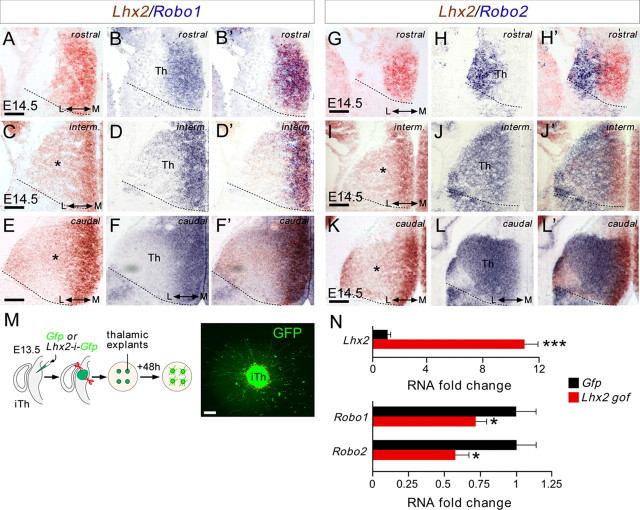
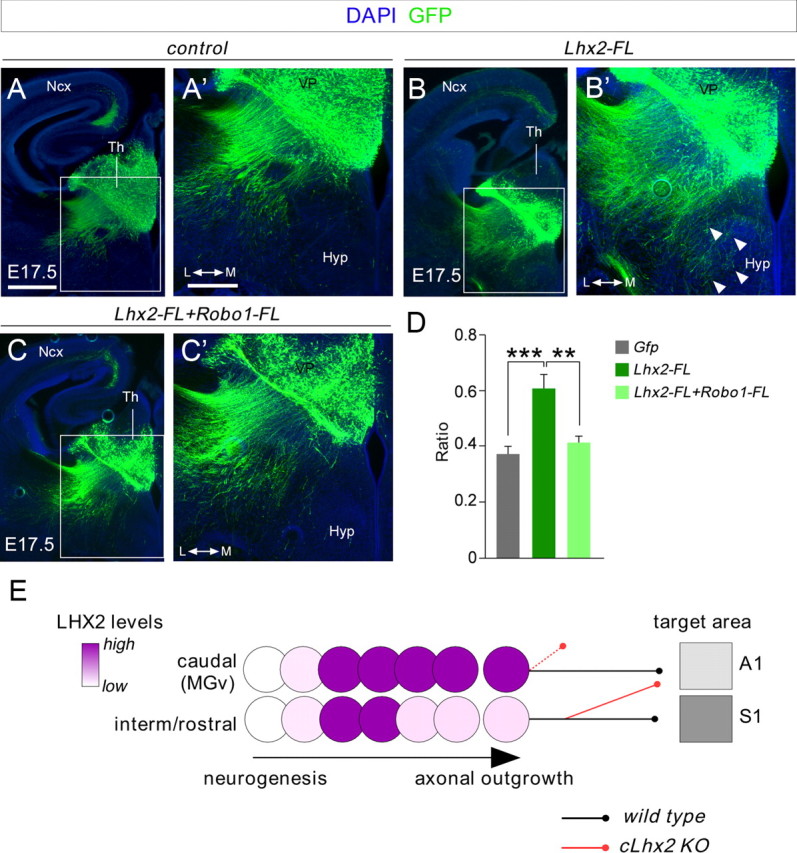
The assembly of neural circuits is dependent upon the generation of specific neuronal subtypes, each subtype displaying unique properties that direct the formation of selective connections with appropriate target cells. Actions of transcription factors in neural progenitors and postmitotic cells are key regulators in this process. LIM-homeodomain transcription factors control crucial aspects of neuronal differentiation, including subtype identity and axon guidance. Nonetheless, their regulation during development is poorly understood and the identity of the downstream molecular effectors of their activity remains largely unknown. Here, we demonstrate that the Lhx2 transcription factor is dynamically regulated in distinct pools of thalamic neurons during the development of thalamocortical connectivity in mice. Indeed, overexpression of Lhx2 provokes defective thalamocortical axon guidance in vivo, while specific conditional deletion of Lhx2 in the thalamus produces topographic defects that alter projections from the medial geniculate nucleus and from the caudal ventrobasal nucleus in particular. Moreover, we demonstrate that Lhx2 influences axon guidance and the topographical sorting of axons by regulating the expression of Robo1 and Robo2 guidance receptors, which are essential for these axons to establish correct connections in the cerebral cortex. Finally, augmenting Robo1 function restores normal axon guidance in Lhx2-overexpressing neurons. By regulating axon guidance receptors, such as Robo1 and Robo2, Lhx2 differentially regulates the axon guidance program of distinct populations of thalamic neurons, thus enabling the establishment of specific neural connections.


Figures

Figure 1.
Figure 1.
Lhx2 protein expression in the forebrain during development. A–I”, Coronal sections from rostral, intermediate, and caudal levels of E12.5 (A–C), E13.5 (D–F), and E14.5 (G–I) embryonic brains showing Lhx2 (green) and L1 (red) immunohistochemistry. Nuclear DAPI staining is shown in blue. Arrowheads indicate Lhx2-positive cells that emit L1 thalamocortical axons at caudal levels. Dotted lines define the border of the thalamus. Rostral (G–G), intermediate (H–H), and caudal (I–I) coronal section images of E14.5 embryonic brains showing the spatial relationship between the Lhx2-expressing cells and the L1-positive axons emerging from the thalamus. Asterisks show the Lhx2 gradient in the thalamus. J, Diagram of rostrocaudal Lhx2-expressing cells showing the gradient of Lhx2 (light to dark green) as well as L1-positive axons (red) coming out from the thalamus. K, Quantification of the Lhx2 expression gradient along the anterior–posterior axes at E12.5, E13.5, E14.5, and E15.5. Th, thalamus; vz, ventricular zone; L, lateral thalamus; M, medial thalamus. Scale bars: (in A) A–C, 100 μm; (in D) D–F, 100 μm; (in G) G–I, 100 μm.
Figure 2.
Figure 2.
Lhx2 expression is dynamically regulated in postmitotic thalamic neurons. A–G', Coronal sections showing immunohistochemistry for Lhx2 (purple), L1 (red), and BrdU (green), after BrdU was injected at E12.5 and E14.5 (D) and allowed to incorporate for 16 (A–D) or 48 h (E–G'). Nuclear DAPI staining is shown in blue. A large percentage of cells at rostral levels and nearly all at intermediate and caudal levels that incorporated BrdU after a 16 h pulse strongly expressed Lhx2 at E12.5 (A–C', filled arrowheads). D, The majority of the cells that incorporated BrdU after a 16 h pulse strongly express Lhx2 at E14.5. After a 48 h pulse, cells that incorporated BrdU at rostral and intermediate levels showed a strong reduction in Lhx2 expression (E, F, open arrowheads), although it remained high in caudolateral regions (G–G', filled arrowheads). C', G', High-magnification images showing colocalization (white) of Lhx2-positive (purple) and BrdU-positive (green) cells with projecting axons (red) at caudal thalamic levels after a 16 and 48 h pulse, respectively. H, I, Quantification of the percentage of BrdU+/Lhx2+ cells (gray bars) and BrdU+/Lhx2− cells (green bars) along the rostrocaudal axes at E12.5, after 16 and 48 h BrdU injection, respectively. J–M', Coronal sections of DiI-injected brains (red) into M1 (J,J'), S1 (K,K'), V1 (L,L'), and A1 (M,M') cortical areas, showing retrograde-labeled cells in the VL, VB, dLG, and MGv thalamic nuclei, respectively. Immunohistochemistry showing Lhx2 expression pattern (green) at the different thalamic nuclei and its relation with the back-labeled cells from the different cortical areas. Only back-labeled axonal fibers from the A1 cortex showed a strong colocalization with Lhx2-positive cells at caudal thalamic levels (M', arrowheads). Insets show the cortical area in which the DiI crystal was placed. N, Diagram showing the dynamic regulation of Lhx2 protein in thalamocortical neurons. vz, ventricular zone. Scale bars: (in A) A, B, C, E, F, G, 100 μm; (in C') C', D, G', 40 μm; (in J) J, K, L, M, 100 μm; (in J') J', K', L', M', 50 μm.
Figure 3.
Figure 3.
Lhx2 overexpression in the thalamus produces defects in thalamocortical guidance. A, Diagram illustrating how thalamocortical axons travel from the thalamus to the cortex at different embryonic stages. B, Schematic diagram of the experimental design used. C, Example of electroporated brain, showing the GFP expression in coronal sections at rostral, intermediate, and caudal thalamic levels respectively. D–F', Lhx2 immunohistochemistry in control (D) and Lhx2-electroporated (E) hemispheres from the same embryo at E17.5. Note Lhx2 is ectopically overexpressed in the electroporated side (E). We inverted D for a better comparison between the nonelectroporated hemisphere (D) and the electroporated one (E–F'). The inset in E indicates the extension of the electroporated area. G, Diagram of the quantification performed. H–L, Coronal sections of E17.5 brains showing GFP (green) immunohistochemistry after in utero electroporation at E12.5 with Egfp or Lhx2-ires-Egfp-expressing plasmids. Nuclear DAPI staining is shown in blue. H', K', Higher-magnification views of H and K to highlight the thalamocortical guidance defects after Lhx2 overexpression. Derailed thalamocortical axons invade the hypothalamic region (arrowheads) in brains overexpressing Lhx2 but not in control brains. I, L, Fewer electroporated axons reach the neocortex when Lhx2 is upregulated in rTh and iTh neurons (arrowheads). J, Quantification of the derailment of TCAs at the hypothalamus. The ratio is the number of pixels along the red lines showing a positive fluorescence after removing the background fluorescence, divided by the total number of pixels along the red lines. Asterisks indicate significance at ***p < 0.001; Student's t test. Data are presented as the mean ± SEM. Th, thalamus; Ncx, neocortex; Str, striatum; GP, globus palidus; Hyp, hypothalamus; H, hypocampus; 3rdv, third ventricle; Po, posterior group of thalamic nuclei. Scale bars: (in H) H, K, 200 μm; (in C) C, H', I, K', L, 100 μm; (in D) D–F, 100 μm; F', 50 μm.
Figure 4.
Figure 4.
Lhx2 represses Robo1 and Robo2 expression in thalamic-projecting neurons. A–L', Consecutive coronal cryostat sections at rostral, intermediate, and caudal thalamic levels of E14.5 wild-type embryos showing Lhx2 (A, C, E, G, I, K, red), Robo1 (B, D, F, blue), and Robo2 (H, J, L, blue) mRNA expression. The merged images are a composite of two consecutive sections for Lhx2 and Robo1 (B', D', F') or Robo2 (H', J', L') in situ hybridization. Asterisks highlight the Lhx2 gradients at the mRNA level. M, Schematic diagram of the experimental paradigm used for quantitative real-time PCR assays. E13.5 slices were electroporated focally with Egfp-coding or Lhx2-ires-Egfp-coding plasmids. Thalamic explants were dissected from the electroporated region and allowed to grow on coverslips coated with poly-l-lysine and laminin. N, Quantitative real-time PCR analysis of Robo1 and Robo2 expression in Egfp-electroporated and Lhx2-electroporated thalamic cells. Histograms show the fold change in RNA expression for Lhx2. Gene expression was normalized using GAPDH. Control conditions where normalized to 1 (±SEM). Asterisks indicate significance at *p < 0.05 and ***p < 0.001, Student's t test. Scale bars: A–L', 200 μm; M, 50 μm.
Figure 5.
Figure 5.
In thalamic neurons, Lhx2 binds to regulatory sequences in the Robo1 and Robo2 genes in vivo. A, B, G, Putative Lhx2 DNA binding sites (orange boxes indicate 6 bp consensus sequences) in the Robo1, Robo2, and Robo3 genes, respectively. C, D, H, ChIP assays reveal that Lhx2 binds to specific enhancer region (TAATTA) of Robo1, Robo2, and Robo3 (in spinal cord) in the embryonic E12.5 thalamic tissue in vivo. Input chromatin represents 1% of the total chromatin. Anti-RNA polymerase II antibody was used as positive control and DNA amplified using control primers specific for the GAPDH promoter. Nonspecific goat serum (goat IgG) was used as negative control (IgGs), and DNA fragments were amplified with primers flanking the studied regions of Robo1, Robo2, or Robo3. The amplicon size (number of base pairs) is indicated for each regulatory sequence. The plotted bars indicate the intensity of the PCR bands, for each region, quantified and normalized to their corresponding input band. For Robo1-region1: 0.05 ± 0.04 (goat IgG) and 0.26 ± 0.16 (Lhx2). For Robo1-region2: 0.12 ± 0.04 (goat IgG) and 0.58 ± 0.12 (Lhx2). For Robo2-region2: 0.80 ± 0.71 (goat IgG) and 0.78 ± 0.33 (Lhx2). For Robo2-region3: 0.11 ± 0.04 (goat IgG) and 0.32 ± 0.05 (Lhx2). For Robo2-region4: 0.27 ± 0.10 (goat IgG) and 0.48 ± 0.10 (Lhx2). For Robo3 in spinal cord: 0.05 ± 0.03 (goat IgG) and 2.28 ± 0.68 (Lhx2). For Robo3 in thalamus: 0.17 ± 0.08 (goat IgG) and 0.65 ± 0.28 (Lhx2). Asterisks indicate significance at *p < 0.05 and **p < 0.01, Student's t test. Data are presented as the mean ± SEM. E, F, Putative Lhx2-binding sequence of genomic rat, mouse, chimpanzee, macaque, human, and dog in Robo1 and Robo2, respectively, showing the degree of conservation between these different species.
Figure 6.
Figure 6.
Conditional deletion of Lhx2 in thalamic neurons augments Robo1 and Robo2 receptor expression in the thalamus. A, B, Schematic diagram illustrating the strategy used to delete Lhx2 in the thalamus at specific developmental stages. C, D, Coronal sections at caudal thalamic levels showing Lhx2 immunohistochemistry in control (C) and in conditional thalamic Lhx2 knock-out mice (D, Th-Lhx2) at E14.5. As expected, Lhx2 expression was strongly reduced in the thalamus of these mice, while the gradient of Lhx2 expression at the cortex remained unaltered (arrowheads). E, Quantitative PCR was performed in the thalamus of control and Th-Lhx2 embryos at E14.5. As expected, the levels of Lhx2 were reduced very significantly in the Th-Lhx2 thalamic embryos. However, the levels of Robo1 and Robo2 were increased compared with the control thalamus. Asterisks indicate significance at *p < 0.05, ***p < 0.001, Student's t test. Data are presented as the mean ± SEM. F–Q, Coronal sections at rostral, intermediate, and caudal thalamic levels showing Robo1 and Robo2 in situ hybridization in control (F, J, N, H, L, P) and Th-Lhx2 (G, K, O, I, M, Q) embryos at E14.5. The expression of both receptors was increased in the absence of Lhx2. R–U, Coronal sections at the caudal thalamic level showing the Robo1 and Robo2 expression in wild-type (R, T) and Lhx2−/− (S, U) embryos at E14.5, respectively. Th, thalamus; Ncx, neocortex; Hp, hippocampus. Scale bars: (in C) C, D, 200 μm; (in F) F–Q, 100 μm; R–U, 200 μm.
Figure 7.
Figure 7.
Conditional deletion of Lhx2 in thalamic neurons provokes premature invasion of the cortical plate. A, Schematic diagram of the strategy used to delete Lhx2 in the thalamus at specific developmental stages. B–E', Rostromedial coronal sections showing GFP immunohistochemistry in control (B–C') and Th-Lhx2 (D–E') brains at E14.5. TCAs invaded the cortical plate (CP) abnormally at these early embryonic stages (D', E', arrowheads). F, O, In situ hibridization for Ngn2 and Gbx2 at E14.5 embryonic brains, showing that there is no difference in the thalamic patterning between the control (F–J) and the Th-Lhx2 (K–O) brains. Th, thalamus; Ncx, neocortex. Scale bars: (in B) B, C, D, E, 300 μm; (in B') B', C', D', E', 200 μm; (in F) F–O, 200 μm.
Figure 8.
Figure 8.
Tracing experiments revealed topographical thalamocortical defects after the conditional deletion of Lhx2 in the thalamus. A, Schematic diagram illustrating the strategy used to conditionally delete Lhx2 by tamoxifen administration and the dye-tracing studies performed. B–E', Coronal sections showing retrograde-labeled cells in the distinct thalamic nuclei after DiI injection (red) into the A1 cortical area and DiA (green) into the S1 cortical area of control (B–C') and Th-Lhx2 (D–E') embryos. After injection in the A1, retrograde-labeled cells were observed in the dLG and MGv nuclei of control brains. However, no retrograde-labeled cells were observed in the MGv of Th-Lhx2 mice and abnormal retrograde labeling was observed in some ectopic thalamic neurons (E–E') in the most caudal part of the VP nucleus. Scale bars: (in B) B, C, D, E, 300 μm; (in B') B', C', D', E', 200 μm.
Figure 9.
Figure 9.
Coelectroporation of Lhx2 and Robo1 in the thalamus rescues the axon guidance phenotype of thalamocortical axons. A–C', Electroporated brains with Gfp (A, A'), Lhx2 (B, B'), and Lhx2+Robo1 (C, C'), respectively, showing the GFP-positive axons that were electroporated. Axons overexpressing Lhx2 and Robo1 follow a normal pathway toward the cortex as control experiments. D, Quantification of the data shown in A', B', and C' at the hypothalamic region as performed in Figure 3. Asterisks indicate significance at **p < 0.01 and ***p < 0.001, one-way ANOVA test with Tukey's post hoc analysis. E, Schematic diagram showing the dynamic regulation of Lhx2 protein in postmitotic thalamic neurons at rostrocaudal levels in relation to TCA pathfinding. Ncx, neocortex; Hyp, hypothalamus. Scale bars: (in A) A, B, C; 300 μm; (in A') A', B', C', 200 μm.

Similar articles

Cited by

References

    1. Andrews W, Liapi A, Plachez C, Camurri L, Zhang J, Mori S, Murakami F, Parnavelas JG, Sundaresan V, Richards LJ. Robo1 regulates the development of major axon tracts and interneuron migration in the forebrain. Development. 2006;133:2243–2252. - PubMed
    1. Angevine JB., Jr Time of neuron origin in the diencephalon of the mouse. An autoradiographic study. J Comp Neurol. 1970;139:129–187. - PubMed
    1. Bach I. The LIM domain: regulation by association. Mech Dev. 2000;91:5–17. - PubMed
    1. Bagri A, Marín O, Plump AS, Mak J, Pleasure SJ, Rubenstein JL, Tessier-Lavigne M. Slit proteins prevent midline crossing and determine the dorsoventral position of major axonal pathways in the mammalian forebrain. Neuron. 2002;33:233–248. - PubMed
    1. Bielle F, Marcos-Mondéjar P, Leyva-Díaz E, Lokmane L, Mire E, Mailhes C, Keita M, García N, Tessier-Lavigne M, Garel S, López-Bendito G. Emergent growth cone responses to combinations of slit1 and netrin 1 in thalamocortical axon topography. Curr Biol. 2011;21:1748–1755. - PubMed

Publication types

MeSH terms