. 2012 Apr 9;209(4):819-35.
doi: 10.1084/jem.20112322. Epub 2012 Mar 26.

Monocytes, neutrophils, and platelets cooperate to initiate and propagate venous thrombosis in mice in vivo

Affiliations

Monocytes, neutrophils, and platelets cooperate to initiate and propagate venous thrombosis in mice in vivo

Marie-Luise von Brühl et al. J Exp Med. .

Abstract

Deep vein thrombosis (DVT) is a major cause of cardiovascular death. The sequence of events that promote DVT remains obscure, largely as a result of the lack of an appropriate rodent model. We describe a novel mouse model of DVT which reproduces a frequent trigger and resembles the time course, histological features, and clinical presentation of DVT in humans. We demonstrate by intravital two-photon and epifluorescence microscopy that blood monocytes and neutrophils crawling along and adhering to the venous endothelium provide the initiating stimulus for DVT development. Using conditional mutants and bone marrow chimeras, we show that intravascular activation of the extrinsic pathway of coagulation via tissue factor (TF) derived from myeloid leukocytes causes the extensive intraluminal fibrin formation characteristic of DVT. We demonstrate that thrombus-resident neutrophils are indispensable for subsequent DVT propagation by binding factor XII (FXII) and by supporting its activation through the release of neutrophil extracellular traps (NETs). Correspondingly, neutropenia, genetic ablation of FXII, or disintegration of NETs each confers protection against DVT amplification. Platelets associate with innate immune cells via glycoprotein Ibα and contribute to DVT progression by promoting leukocyte recruitment and stimulating neutrophil-dependent coagulation. Hence, we identified a cross talk between monocytes, neutrophils, and platelets responsible for the initiation and amplification of DVT and for inducing its unique clinical features.


Figures
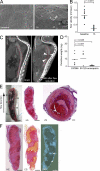
Figure 1.
Figure 1.
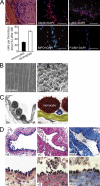
A novel clinically relevant mouse model of DVT. (A) Scanning electron microscopic images of the IVC. Images taken immediately after (baseline) and 1 h after partial ligation in the IVC illustrate the intact endothelial cell lining of the IVC without endothelial disruption. Bars, 5 µm. Shown is a representative of n = 3 experiments. (B) Assessment of blood flow in the IVC in response to partial ligation (n = 16). Dots represent individual experiments; lines show the mean of each group. (C) Evaluation of DVT by contrast-enhanced computed tomography (CT) 48 h after flow restriction in the IVC (also see Video 1). CT images were acquired in a sagittal projection using a small animal CT scanner. Right: animal with DVT at 48 h after flow restriction. The dotted line shows the IVC in the abdominal cavity. Arrowheads point to the lack of contrast agent, indicating thrombus formation. Left: control animal with sham ligation showing continuous contrast filling of the IVC. Shown is a representative of n = 3 experiments. (D) Weight (milligrams) of harvested IVC thrombi 48 h after DVT induction in C57BL/6 (n = 6), SV129 mice (n = 4), and after enoxaparin treatment (n = 5). Dots represent individual experiments; lines show the mean of each group. (E) Macroscopic and microscopic assessment of venous thrombi after 48 h of flow restriction in C57BL/6 animals. Regions of red (R) and white (W) thrombus can be distinguished macroscopically (left) and microscopically in a longitudinal (middle) and cross section (right) stained with van Gieson (vG). The thrombus shows the typical white and erythrocyte-rich red layers. Bars: (left and middle) 1 mm; (right) 100 µm. Shown is a representative of n = 10 experiments. (F) Excised thrombosed IVC obtained 48 h after induction of DVT in C57BL/6 animals. Regions of red and white thrombus can be distinguished microscopically in a longitudinal HE-stained section. Carstairs staining (CS) is demonstrating the layers of fibrin, platelets, and red blood cells throughout the thrombus, and DAPI staining illustrates the distribution of leukocytes in clusters (arrow) and layers (arrowhead). Bars, 1 mm. Shown is a representative of n = 3 experiments.
Figure 2.
Figure 2.
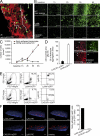
Leukocytes are recruited during the early phase of venous thrombosis to the intact endothelial surface. (A) Leukocyte accumulation in DVT induced by 48 h of flow restriction. vG (top left) and immunohistochemical stainings (middle and right, top and bottom) for Ly6G+ MPO+ neutrophils and F4/80+ monocytes. Nuclei are counterstained with DAPI. Bars, 50 µm. The bottom left shows the quantification of neutrophils and monocytes. Results are mean ± SEM (n = 3). (B) Scanning electron microscopic images taken directly after partial IVC ligation showing the intact endothelium. After 6 h, a carpet composed of cell aggregates and fibrin can be visualized on the endothelial surface. Bars, 5 µm. (C) TEM images of venous vessels showing the anticoagulant endothelial cell lining (pseudocolored in yellow). Bar, 5 µm. Detail is shown in the right image. (D) Histological analyses of the IVC 6 h after flow reduction examining leukocyte recruitment in the early phase of venous thrombus formation. Histological sections in three different stainings (HE, vG, and MSB). Bars: (top row) 20 µm; (bottom row) 10 µm. Data are representative of n = 3 experiments per group.
Figure 3.
Figure 3.
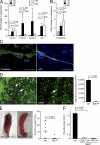
Neutrophils and monocytes are the main leukocyte subsets accumulating during the initiation of DVT. (A) Neutrophils (green) crawling on the vessel wall (red) of the IVC 2 h after DVT induction visualized by two-photon microscopy. Tracks of individual neutrophils are shown in white (also see Video 3). Bar, 50 µm. Shown is a representative of n = 3 experiments. (B) Time course of early leukocyte–endothelial interaction within 6 h of flow restriction as evaluated by intravital microscopy in WT animals using Acridine orange (WT + acr orange). Baseline images were taken before ligation. LysM-eGFP mice were used to evaluate neutrophils and CX3CR1-eGFP mice were analyzed to evaluate monocytes. Bars, 100 µm. Shown is a representative of n = 5 experiments. (C) Dynamics of the recruitment of distinct subsets of innate immune cells during DVT initiation determined in vivo by video microscopy. Rolling and firm adhesion of leukocytes are given as number per square millimeter. Results are shown as mean ± SEM (n = 5 per group). (D, Left) Relative frequency of neutrophils and monocytes at 6 h of flow restriction as assessed by intravital video microscopy. Results are mean ± SEM (n = 5 per group). (D, Right) Representative images taken by intravital epifluorescence microscopy showing blood cell recruitment 6 h after flow restriction in the IVC. Neutrophils were visualized in LysM-eGFP mice. The number of recruited monocytes was assessed using CX3CR1-eGFP mice. In both strains of mice, all leukocytes (irrespective of their lineage) were identified by counterstaining with the fluorescent dye Acridine orange (pseudocolored in red). Bars, 100 µm. (E) FACS analysis of blood in LysM-eGFP and CX3CR1-eGFP mice without IVC ligation using a neutrophil specific anti-Ly6G antibody. (F) Intravital two-photon microscopy of LysM-eGFP and CX3CR1-eGFP with PE-labeled anti-Ly6G antibody 6 h after DVT induction (left). Bars, 50 µm. Quantification of Ly6G+ GFP+ double-positive cells in these mouse strains (right; Videos 4 and 5). Shown is a representative of n = 3 experiments.
Figure 4.
Figure 4.
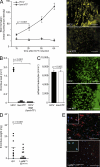
Crucial role of P-selectin for leukocyte accumulation in DVT. (A) RT-PCR of trafficking molecules in the IVC in response to flow restriction at baseline or 6 and 48 h after DVT induction (n = 5 per group). Results are shown as mean ± standard deviation. (B) RT-PCR of P-selectin in the IVC at baseline or 6 and 48 h after DVT induction (n = 5 per group). Results are shown as mean ± standard deviation. (C) Representative immunohistochemical stainings of the IVC endothelium 48 h after DVT induction showing P-selectin and vWF on the endothelial surface. Nuclei are counterstained with DAPI. Bars, 50 µm. (D, Left) Representative in vivo images of adherent leukocytes in C57BL/6 and SELP−/− mice 6 h after induction of DVT. Leukocytes were stained with Acridine orange and visualized by intravital video microscopy (arrowhead indicates aggregates; arrows indicate single adherent cells). Bars, 100 µm. (D, Right) Quantitative analysis of firm leukocyte adhesion, 6 h after flow restriction. Firm cell adhesion is given in number per square millimeters of C57BL/6 (n = 5) and SELP−/− (n = 7). Data are shown as mean ± SEM. (E, Left) Representative images of the excised IVC including the thrombus after 48 h in C57BL/6 and SELP−/− mice. Bars, 1 mm. (E, Right) Thrombus weight in C57BL/6 (n = 8) and SELP−/− mice (n = 4) 48 h after DVT induction. Dots represent individual experiments; lines show the mean of each group. (F) Histological analysis of the harvested IVC thrombi 48 h after flow reduction given as thrombus load in square millimeters (n = 5). plt, platelets. Data are shown as mean ± SEM.
Figure 5.
Figure 5.
Blood cell TF is indispensable for venous thrombosis. (A) Fibrin formation during DVT development was measured in vivo by intravital microscopy in control HCV and low-hTF mice using an Alexa Fluor 488–labeled specific fibrin antibody. Measurements were performed after 1–6 h of flow restriction. Representative images acquired by intravital microscopy of the IVC are shown on the right (fibrin pseudocolored in yellow). Bars, 100 µm. n = 3 per group. Data are shown as mean ± SEM. (B) Thrombus load was assessed on vG-stained serial sections in low-hTF (n = 10) and HCV mice (n = 5), as well as in bone marrow chimeras lacking blood cell TF (n = 6). Thrombus load is given as square millimeters. Dots represent individual experiments; lines show the mean of each group. (C) Assessment of leukocyte recruitment 6 h after flow reduction by intravital microscopy. Leukocytes were visualized using i.v. application of the fluorescent dye rhodamine 6G (pseudocolored in green). The number of adherent cells is given as number per square millimeters (n = 3 per group). Representative in vivo images are shown on the right. Bar, 100 µm. Data are shown as mean ± SEM. (D) Thrombus weight (at 48 h) in control mice (n = 10) and in conditional mutants (LysMCre-TFflox/flox) lacking TF in LysM+ myeloid cells (n = 12). Dots represent individual experiments; lines show the mean of each group. (E) Immunohistochemical detection of TF protein (red) on Ly6G-positive (green) and -negative cells in thrombi at 48 h of flow restriction, indicating TF expression on neutrophils (yellow; TF+ and Ly6G+) and monocytes (red; TF+ and Ly6G). LysMCre-TFflox/flox mice (bottom) were used as negative control. Nuclei are stained with DAPI. Bars, 100 µm. Shown is a representative of n = 3 experiments.
Figure 6.
Figure 6.
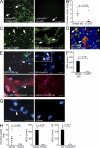
NETs propagate DVT in vivo. (A) Leukocyte accumulation in vivo at 6 h of flow restriction in the IVC of LysM-eGFP mice treated with control antibody or the anti-Ly6G mAb to deplete neutrophils. Arrowhead: aggregated neutrophils; arrows: single, adherent cells. Bars, 100 µm. (B) Thrombus weight 48 h after DVT induction in isotype and anti-Ly6G–treated WT mice (n = 6 per group). Dots represent individual experiments; lines show the mean of each group. (C) Representative image of n = 3 experiments of intravital microscopy 3 or 48 h after flow reduction showing Sytox Green+ NETs in the IVC. Bars, 50 µm. (D) Visualization of NETs in vivo by 2-photon microscopy. Ly6G-positive neutrophils (green, FITC anti-Ly6G antibody) attached to the vessel wall (blue) release Sytox orange–positive (red) NET structures inside the IVC 4 h after flow reduction (also see Video 7). Sytox orange–positive nuclei correspond to dying neutrophils, which have not (yet) exposed their DNA to the extracellular space. Arrowhead: extracellular DNA; arrow: neutrophil. Bar, 50 µm. (E) Immunohistochemical visualization of NETs by staining for DNA (Hoechst), MPO, NE, and histones (H2A-H2B-DNA, H3) in the IVC of WT mice 48 h after induction of DVT. Hoechst+ DNA originating from MPO+NE+ neutrophils (arrows) could be detected. Arrows, nuclei; arrowheads, NET fibers. Bars, 10 µm. (F) Number of NETs in neutropenic mice were quantified in thrombi after treatment with anti-Ly6G and isotype control antibody (n = 3 per group). Data are shown as mean ± SEM. (G) Representative images of WT thrombi stained with Hoechst after DNase1 treatment. Arrowhead, NET fiber. Bars, 10 µm. Shown is a representative of n = 3 experiments. (H) After injection of DNase1, thrombus weight (left) in the IVC was determined after 48 h of flow restriction. Dots represent individual experiments; lines show the mean of each group. Quantification of NETs is also shown (right) as mean ± SEM. Data were obtained in WT injected with normal saline i.v. (n = 14) or DNase1 (n = 6). (I) Quantification of NETs at 48 h in the enoxaparin-treated animals (n = 4 per group). Data are shown as mean ± SEM.
Figure 7.
Figure 7.
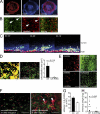
Platelet recruitment supports DVT formation in vivo. (A) Immunohistological cross sections of the IVC 48 h after DVT induction display platelet accumulation (CD41+) within the thrombus. Nuclei are counterstained with DAPI. Bars, 200 µm. Representative of n = 3 experiments. (B) Representative images of intravital video microscopy of blood cell recruitment taken at 6 h after DVT induction. Arrowheads: thrombi; arrows: single, adherent cells. Platelets, red (rhodamine B); leukocytes, green (Acridine orange). Bars, 100 µm. (C) Time-lapse images of the developing thrombus (arrowheads) visualized by two-photon microscopy 6 h after DVT induction. Platelets (yellow) and neutrophils (green) are recruited from the bloodstream (blue) to the vessel wall (red; see also Video 8). (D) Platelet–leukocyte interaction was determined by intravital microscopy in C57BL/6 and IL4-R/Iba mice after 6 h of flow restriction. Bars: (left) 50 µm; (right) 100 µm. The right panel shows quantification of colocalization of leukocytes and platelets in WT (n = 5) and IL4-R/Iba mice (n = 4). Data are shown as mean ± SEM. (E) Representative images obtained by video microscopy 6 h after DVT induction in IL4-R/Iba and control animals (n = 3 per group). Platelets are pseudocolored in red (DyLight488-labeled GPIbβ antibody) and leukocytes in green (Acridine orange). Bars, 100 µm. (F) Representative images taken by intravital microscopy of WT mice 1 h after induction of venous (left) and 5 min after arterial (right) thrombosis. Arrows show platelet aggregate formation. Leukocytes are fluorescently labeled (green) by i.v. application of Acridine orange. Bars, 50 µm. (G) Quantitative analysis of platelet (plt) and leukocyte (lcs) accumulation (as percentage of WT controls) in IL4-R/Iba (n = 3) and WT mice (n = 5). Data are shown as mean ± SEM. (H) Thrombus weight at 48 h after DVT induction in C57BL/6 (n = 8) and IL4-R/Iba mice (n = 5). Dots represent individual experiments; lines show the mean of each group.
Figure 8.
Figure 8.
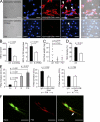
Platelets induce NET formation, which triggers FXIIa-dependent thrombus propagation. (A) Freshly isolated human neutrophils were incubated with platelet supernatant. Cells were stained with a primary antibody directed against DNA–histone complexes and DAPI and visualized by confocal microscopy. Incubation with DNase1 where indicated. Bars, 50 µm. Arrowheads, cell nucleus; arrows, NET. (B) The total number of NETs (left) and NETs per leukocyte (right) was quantified on cross sections of thrombi 48 h after flow restriction in IL4-R/Iba mice and WT animals (n = 3 per group). Data are shown as mean ± SEM. (C) Analysis of thrombus formation (milligrams) in the IVC of C57BL/6 (n = 9), FXII−/− deficient (n = 7), and FXI−/− deficient mice (n = 7) 48 h after flow reduction. Dots represent individual experiments; lines show the mean of each group. (D) Quantification of fibrin density as percentage of fibrin-covered area in the IVC thrombus (n = 4 per group). Data are shown as mean ± SEM. (E) The effects of co-incubation of activated platelets (P) and neutrophils (N) on FXII activation in vitro. NETosis was inhibited by an antibody directed against the H2A–H2B–DNA complex. Data are shown as mean ± SEM. (F) Confocal visualization of FXII on NETs, released from isolated human neutrophils. Arrow, FXII bound to Sytox Green+ NETs. Bars, 10 µm.

Similar articles

Cited by

References

    1. Ammollo C.T., Semeraro F., Xu J., Esmon N.L., Esmon C.T. 2011. Extracellular histones increase plasma thrombin generation by impairing thrombomodulin-dependent protein C activation. J. Thromb. Haemost. 9:1795–1803 10.1111/j.1538-7836.2011.04422.x - DOI - PubMed
    1. Angelillo-Scherrer A., de Frutos P., Aparicio C., Melis E., Savi P., Lupu F., Arnout J., Dewerchin M., Hoylaerts M., Herbert J., et al. 2001. Deficiency or inhibition of Gas6 causes platelet dysfunction and protects mice against thrombosis. Nat. Med. 7:215–221 10.1038/84667 - DOI - PubMed
    1. Brill A., Fuchs T.A., Chauhan A.K., Yang J.J., De Meyer S.F., Köllnberger M., Wakefield T.W., Lämmle B., Massberg S., Wagner D.D. 2011. von Willebrand factor-mediated platelet adhesion is critical for deep vein thrombosis in mouse models. Blood. 117:1400–1407 10.1182/blood-2010-05-287623 - DOI - PMC - PubMed
    1. Brinkmann V., Reichard U., Goosmann C., Fauler B., Uhlemann Y., Weiss D.S., Weinrauch Y., Zychlinsky A. 2004. Neutrophil extracellular traps kill bacteria. Science. 303:1532–1535 10.1126/science.1092385 - DOI - PubMed
    1. Bucek R.A., Reiter M., Quehenberger P., Minar E. 2002. C-reactive protein in the diagnosis of deep vein thrombosis. Br. J. Haematol. 119:385–389 10.1046/j.1365-2141.2002.03886.x - DOI - PubMed

Publication types